Figure 1 Geometry of two orbits and the line-of-sight plane
藤原 智・中川弘之・村上 亮・西村卓也(国土地理院)・飛田幹男(建設大学校)
Satoshi Fujiwara (fujiwara@gsi-mc.go.jp), Hiroyuki Nakagawa,
Makoto Murakami, Takuya Nishimura (Geographical Survey Institute) and Mikio
Tobita (Construction College)
Mount Iwate is a volcano situated in northern Japan. The last eruption was in 1919 and recently it has become active since 1995. Furthermore, number of earthquakes increased dramatically in the end of April 1998. Suddenly a large earthquake (moment magnitude Mw=6.1) occurred on 3 September 1998 to the southwest of Mount Iwate. We show two-dimensional vector field maps of surface displacement (2.5-D displacement) associated with the large earthquake and preceding volcanic inflation, combining satellite radar interferometry images from two different track directions. The detailed displacement revealed that there are two large ruptures associated with known active faults.
1995年頃から,岩手山地下の地震活動が活発化してきたが,1998年4月末に急激に火山性地震数が増加し,顕著な地殻変動がGPSなどによって観測された。また,1998年9月3日には岩手山の南西部にあたる葛根田川付近を震源とする岩手県内陸北部の地震(M6.1)が発生した。こうした火山活動や地震活動の詳細を調べるためにJERS-1の干渉SAR画像を使用して地殻変動を求めた。
使用データは,1996年4月から1998年10月までのdescending 6シーン,ascending 4シーンを使用した。一般に干渉SARは衛星-地表間の視線方向のみの変動が得られる。今回の解析ではdescendingとascendingの異なる軌道からのデータが得られている。そこで,異なる方向の観測の2つの視線方向を含む面上の変動ベクトルを合成し,疑似上方向と東西方向の変動に分離した。
Figure 1 Geometry of two orbits and the line-of-sight plane
(1)地震前の火山性地殻変動
1998年4月30日までの干渉SAR画像には有意な地殻変動は写っていない。GPS観測によれば,岩手山を中心として,ダイクの貫入によるような南北方向の伸張があったのだが,ascendingとdescendingのどちらについても視線方向と直交する方向の変動であるので,干渉SARからは検出できなかった。
これに対して,4月以降岩手山の西方の三ツ石山付近を中心とする地殻変動が干渉SAR,GPSともに観測された。干渉SARからは,変動の中心から四方に広がる,風船を膨らませるような等方的な変動が観測された(最大約10cm)。これは,地下深部のマグマ等が茂木モデル的に膨らんだとしたとして説明できる。
(2)地震による地殻変動
9月3日の地震によるコサイスミックな変動をFigureに示す。疑似上方向と東西方向に分離して表示してあるので,変動の詳細が把握しやすい。たとえば,主断層として,平行する既存の西根従属断層と晴山沢断層の北端部が数10cm動いたことがはっきりとわかる。また,こうした主断層以外にも同時もしくは余震活動の一部として動いた断層が複数あることがわかった。
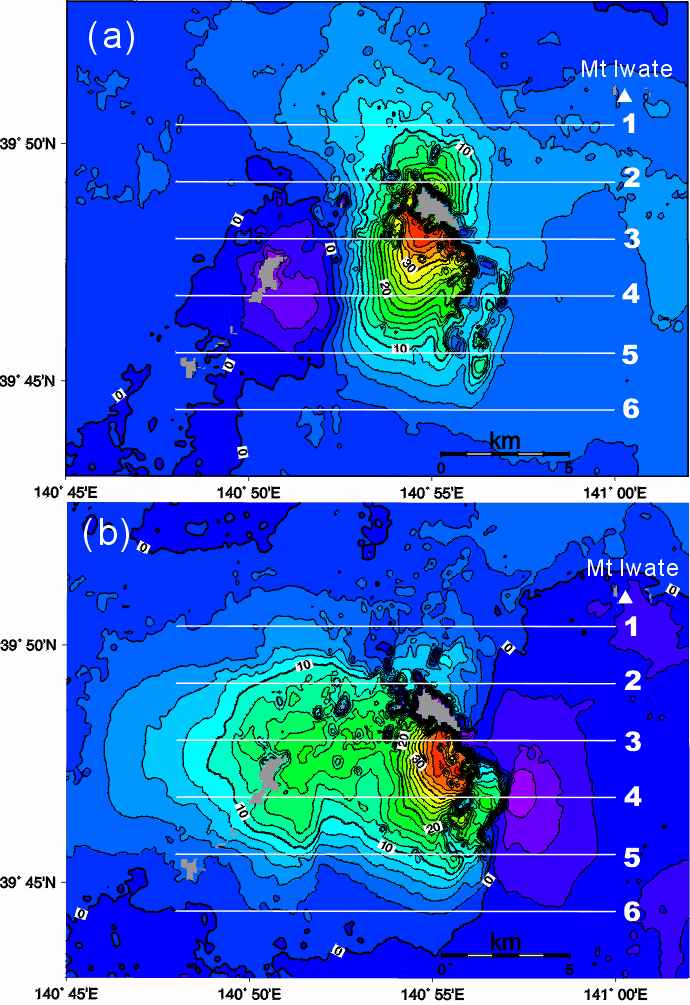
Figure 2 (a) Quasi-upward and (b) eastward displacements from July
1998 to September 1998 around Mount Iwate (cm, contour interval is 2 cm),
combining JERS-1 radar interferometry images from two different track directions.
Figure 3 Cross sections along lines shown in Figure 2