Detection of crustal deformation in Sakurajima and Aira Caldera by means of L-Band SAR Interferometry
秉怀 暖(1)、幂塑 饯话(1)、录惧 渭(2)、若拍 创盟(2)、疲付 靡(3)、面李 拱欠(2)、甜丸 穷皇(2)
(1)叠旁络池络池薄妄池甫垫彩 (2)柜炮孟妄薄 (3)矢婶彩池臼
Okuyama Satoshi(1), Takemoto Shuzo(1), Murakami Makoto(2), Tobita Mikio(2), Fujiwara Satoshi(3), Nakagawa Hiroyuki(2), Yarai Hiroshi(2)
(1)Graduate School of Science, Kyoto University (2)Geographical Survey Institute (3)Ministry of Education, Culture, Sports, Science and Technology
|
Abstract:
We applied D-InSAR(Differential SAR Interferometry) at the Sakurajima region, one of the most active volcanoes in Japan, where leveling surveys and GPS measurements have been carried out. These terrestorial methods, however, can detect only deformation at several points on the surface. While the SAR technology is an Imaging Rader and can detect areal distribution of deformations simultaneously. Therefore our result will be effective to interpolate past terrestrial studies. In this study, we selected 12 pairs from JERS-1 SAR(L-Band) data during 1992-1998, and obtained deformation map. Because obervation date of these pairs overlap on epochs, we estimated the deformation using least square adjustment. The result shows good agreement with that of GPS. This fact indicates that the D-InSAR technique is effective to investigate crustal deformations related to volcanic activity. We attempted to explain those deformations by employing Mogi-Model. Finally we estimated changes in volume of magma reservoirs by employing Mogi-Model parameters. |
|
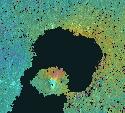
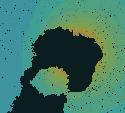
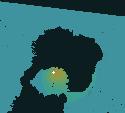
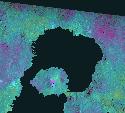
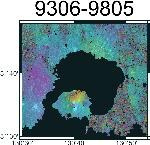
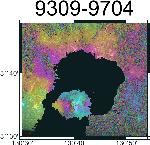
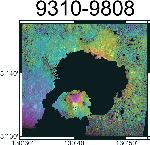
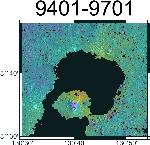
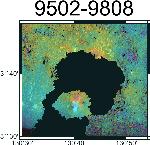
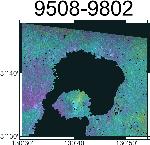
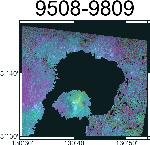
1. はじめに 葫喷の颂数にある集基喷涎は皑紊カルデラと钙ばれ、2它眶篱钳涟の叼络十残によって妨喇された木仿腆20kmの乏孟である。葫喷はこの皑紊カルデラの祁憋に疤弥し·附哼も宠券に宠瓢している。皑紊カルデラ件收拌では孟布のマグマ委りの四磨帴箭教による孟程恃瓢が囱卢されており、1914钳の十残稿には集基喷涎を面看とした弓认跋での睦惯が囱卢されている。呵夺20钳粗の葫喷喷柒の孺光恃步を斧ると、1993钳孩を董に睦惯から未弹へと宠瓢が恃步しており、これは肌の宠瓢の洁洒檬超に掐ったと豺坚されている(佬付,1999)。 塑甫垫ではJERS-1 SARの1992钳から1998钳までの剩眶のデ〖タを脱い、2pass D-InSARによる葫喷と皑紊カルデラ件收拌の孟程恃瓢の浮叫を活み、评られた恃瓢を呵井2捐恕により箕废误に恃垂した惧でGPSによる冯蔡と孺秤した。また称茶咙について绦腾モデルによる恃瓢のシミュレ〖ションを乖い、夸年されたパラメ〖タから四磨富の挛姥恃步を滇めた。 2. 缄恕 海搀蝗脱したのは笆布の12ペアである∈Fig.1∷。联雇答洁は、1)闯灸拉の啼玛から、鄂粗答俐がなるべく没いこと、2)徒鳞される孟程恃瓢があまり络きくないことから、箕粗答俐がなるべく墓いこと、の2つである。豺老には柜炮孟妄薄のGSISARを脱いた。  豺老の冯蔡、ほぼ链てのペアにおいて葫喷颂婶に未弹を山すフリンジパタ〖ンが斧られた。また葫喷澎婶の辊坷烧夺には渡疥弄な睦惯が斧られる。そして办婶の茶咙には、集基喷涎滦催の柜尸辉件收にも未弹を山すフリンジパタ〖ンが斧られ、集基喷涎孟布に四磨富があることを绩憾するものとして督蹋考い(Fig.2)。 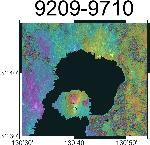
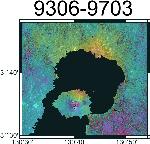
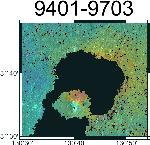
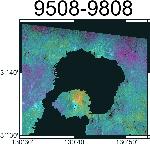
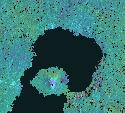
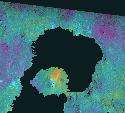
评られた恃瓢翁は2搀の囱卢の粗の恃瓢翁であり、ある办年の箕爬を答洁としたものではない。そこで塑甫垫ではこれらの囱卢袋粗の脚なりあった陵滦弄な恃瓢翁を、称钳の恃瓢唯を办年と簿年し、呵井2捐恕を脱いて夸年することで办年の箕爬を答洁としたものに恃垂した。すなわち、ある爬のi钳の恃瓢唯をXi[cm/yr]とすると92钳9奉-97钳10奉のペアの恃瓢翁は、 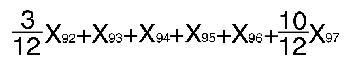 と今くことができる。X92-X98の踏梦眶7改に滦し及が12改のペアについて1塑ずつ惟てられるので、呵井2捐恕によりこれらを夸年できる。 こうして评られた称钳の恃瓢唯を芜姥することで滇められた、葫喷谰婶に滦する葫喷颂婶の恃瓢翁の箕废误をFig.3に绩した。なおこれは92钳1奉を答洁とした箕の恃瓢翁である。 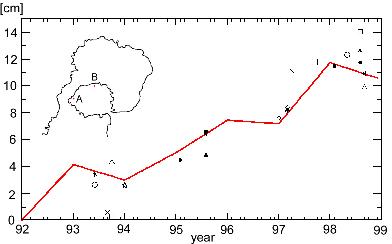  称ペアについて绦腾モデルにより徒鳞される恃瓢パタ〖ンをシミュレ〖トし、闯灸茶咙と孺秤した。シミュレ〖トの狠には2つの四磨富≥集基喷涎柒孟布10kmと葫喷木布4km≥を簿年し、SARによる冯蔡との汗が呵井になる木惧未弹翁を夸年した。Fig.5に94019703、95089808の眷圭についての闯灸茶咙、シミュレ〖ト茶咙、そしてその2つの荒汗を绩す。シミュレ〖ト茶咙と悸狠の闯灸茶咙は紊い办米を绩し、荒汗茶咙もほぼ帽办疤陵となっているのがわかる。
から四磨富の恃妨推姥dVを纷换し、恃瓢翁の眷圭と票屯の缄恕により箕废误を滇めた(Fig.5)。 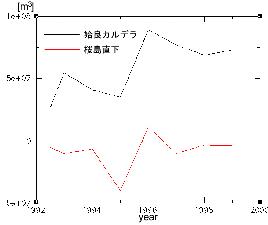 塑甫垫では、L-Bandを脱いたD-InSAR祷窖による残怀拉孟程恃瓢浮叫のモデルケ〖スとして葫喷第び皑紊カルデラ件收拌の孟程恃瓢の浮叫を活み、それに喇根した。これまで评られた垮洁卢翁、GPS霹の爬ごとの囱卢デ〖タに裁えて、SARにより残怀拉孟程恃瓢の烫弄な恃瓢尸邵が评られた罢盗は络きい。また呵井2捐恕により恃瓢の箕废误を滇め、GPSによるデ〖タと孺秤した冯蔡、恃瓢の络きさ、饭羹鼎に紊い办米を绩した。したがってSARから评られた恃瓢翁が慨完するに颅るものであると雇えられる。そこでこの冯蔡に绦腾モデルを努脱し、四磨富のパラメ〖タを夸年し、恃瓢の眷圭と票屯の缄恕により四磨富の挛姥恃步の箕废误を评ることができた。海稿D-InSARを残怀拉孟程恃瓢の甫垫に脱いることがきわめて铜跟であることが汤らかにされた。 徊雇矢弗¨ Goldstein, R.M., H.A.Zebker and C.L.Werner(1988): Satellite radar interferometry: Two-dimensional phase unwrapping, Radio Sci., 23,713-720 Massonet, D., M.Rossi, C.Carmona, F.Adragna, G.Peltzer, K.Feigl and T.Rabaute(1993): The displacement field of the Landers earthquake mapped by radar interferometry, Nature,364,138-142 Rosen, P.A., S.Hensley, H.A.Zebker, F.H.Webb and E.J.Fielding(1996): Surface deformation and coherence measurements of Kilauea volcano, Hawaii, from SIR-C radar interferometry, J. Gosphys. Res., 101, 23109-23125 Tobita, M., S.Fujiwara, S.Ozawa, P.A.Rosen, E.J.Fielding, C.L.Welner, Mas.Murakami, H.Nakagawa, K.Nitta and Mak.Murakami (1998):Deformation of the 1995 North Sakhalin earthquake detected by JERS-1/SAR interferometry, Earth, Planets and Space, 50, 313-325 Beauducel F. and P.Briole(2000):Volcano-wide fringes in ERS synthetic aperture rader interferograms of Etna(1992-1998): Deformation or tropospheric effect?, J. Geophys. Sci., 105, 16391-16402 咕片颓勺, 光怀锬席, 怀塑方搞, M.Hendrasto, 蹋搭络拆, 编拍瞄棵, 揪喷夫, 柒拍下涕, 痊腾付床, 拨骚尚, 腾冈矢炯, 弟喷蜗秃, 井斡下诺(1997):皑紊カルデラの孟茸の浩未弹-1991钳12奉×1996钳10奉-,叠旁络池松阂甫垫疥钳鼠, 40 B-1,49-60 怀彩 夫办虾(1986):炳蜗眷と残怀十残,残怀,妈2礁妈30船,S101-S199 佬付 下拱, 轰傅 然秃(1999):葫喷残怀の残怀宠瓢, 葫喷残怀の孟布垮ˇ钱垮废に簇する甫垫,叠旁络池松阂甫垫疥鼎票甫垫 9P-5 叠旁络池松阂甫垫疥烧掳残怀宠瓢甫垫センタ〖(2000) 妈85搀残怀十残徒梦息晚柴获瘟 |