4-8. Study of seismological properties of the subdution plate boundary in the
Sariku region of the Japan
In past, large interplate earthquakes occurred along the
subduction zones at the Kuril Trench, the Japan Trench, the Nankai Trough, the
Hyuganada, and the Nansei-Syoto Trench. The physical process for these interplate
earthquakes seems not well understood. During the 8th Earthquake
Prediction Program, we are attempting to understand physical process for the interplate
earthquakes by knowledge of physical properties of material along the plate boundary
by means of the seismological approach.
The detailed hypocenter
distribution in the Sanriku region has been well studied by the land seismic
network. Two aseismic zones in 38º40’N-39ºN and 39º10’N-39º20’N with E-W width
of ~100km has been identified for past several decades. It is a question which
is the case, a high potential place for a next large earthquake or an
aseismically slipping region by stable sliding. In 1996, we carried out an
OBS-control source experiment in this region. Using a travel time inversion
method, it is found that the plate boundary along the 143º15’E longitude is
located at depth of 10km below the ocean floor and is rather flat over
140km-long. However, the intensity of the P-P reflected waves at the plate
boundary has a good correlation with seismic activity, that is, high in the
aseismic zone and low in the seismically active zone (Fujie et al., 2000,
2002). Under the constrain of travel time inversion allowance, it is estimated that
Vp for the plate boundary material is ~3-4km/s, and its thickness is a few
hundred meters corresponding to high reflectivity. As low Vp may suggest to be
mechanically weak, such material may cause a stable sip to release strain
energy associated with the plate subduction. Such low Vp material may be caused
by high fluid contents and/or comprise hydrous minerals such as clay or
serpentine.
The 1996 experiment was
carried out only for the N-S line, and it is worth to confirm the 1996 results
in the whole aseismic zone with 100km E-W width. To map the physical properties
of the whole aseimic zones around 39ºN, we carried out a seismic experiment in
2001. Fig. 1 shows the distribution of epicenters shallower than 100km and
grater than M3, and the location of seven survey lines. Fig. 2 shows Vp structures
nearly along Line 3 (NS line) and perpendicular
line to Line 3 obtained in Fujie et al. (2000). One example of record sections
is shown in Fig. 3. Theoretical travel times for PP reflected waves at the plate
boundary is shown by green lines.
Observed records are affected
by source energy, geometrical spreading and incident angles. To evaluate the
effects of incident angle and physical properties of plate boundary, we calculated
synthetic seismograms. Fig. 4 is a theoretical seismogram calculated using
Vp=2km/s, Vs=800m/s, and layer thickness =100m assuming an appropriate Q structure.
The result resembles to observed records. Comparing observed and synthetic
records, we can estimate heterogeneity of reflectivity at the plate boundary using
observed data if incident is not close to normal.
Fig. 6 shows the Move-out
Record Section after the correction of geometrical spreading and source energy
variation. Vertical axis is move-out travel time and horizontal axis is the
location of reflection. 0-sec corresponds to the plate boundary. We can
identify the variation of reflectivity along the survey line. Fig. 6 is a composite
Move-out Record Section using the data along a particular line.
Fig. 7 shows a comparison of
observed results and seismicity. This strongly supports the result obtained by
Fujie et al. (2002), that is, high reflectivity at the aseismic region and low reflectivity
for the seismically active regions.
Comparing synthetic
seismograms and observed ones for Line 3-7, we can conclude that the plate
boundary material may comprise a layer withVp~3-4kms/, Vp/Vs~3 and thickness ~100m.
Such material can reduce the seismic activity due to low mechanical strength.
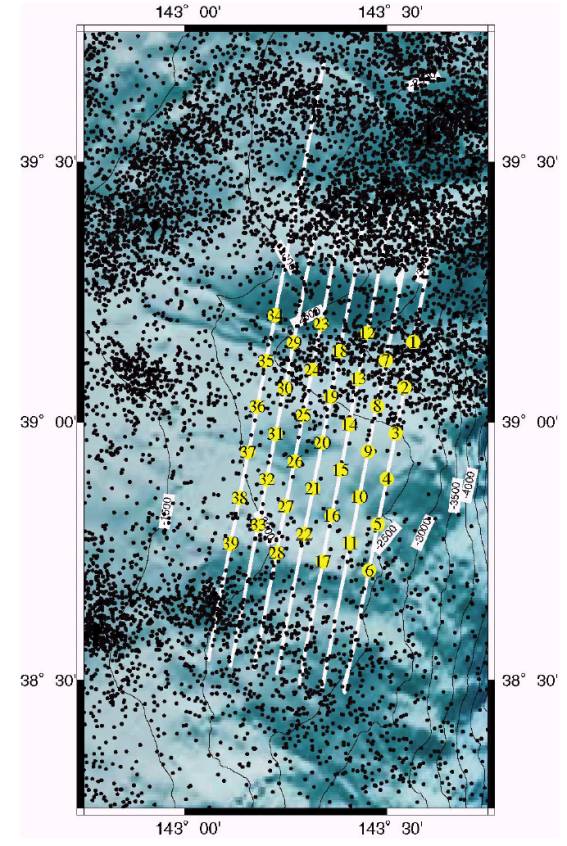
Fig. 1: Location
of Lines 1(east) to 7(west) and epicenters with M greater than 3 and depth
shallower than 100km.
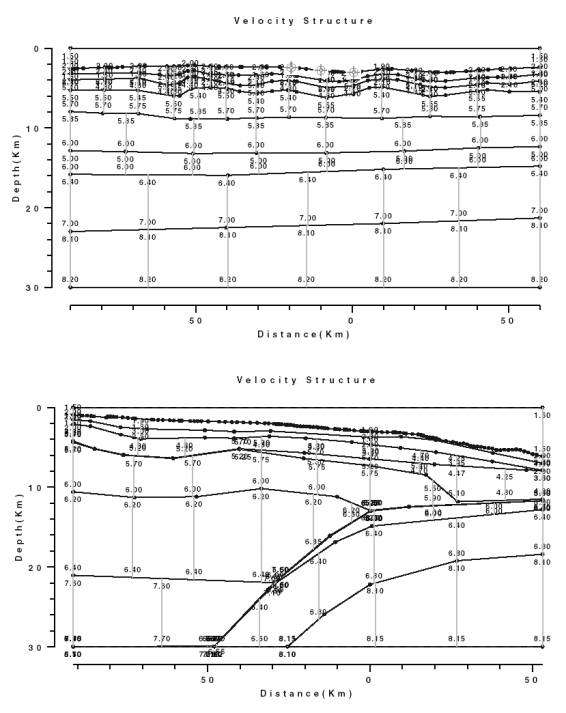
Fig. 2: (a) N-S Vp structure along Line 3 in Fig.1
and (b) E-W Vp structure perpendicular to Line 3 at 39ºN (after Fujie e al.,
2000).
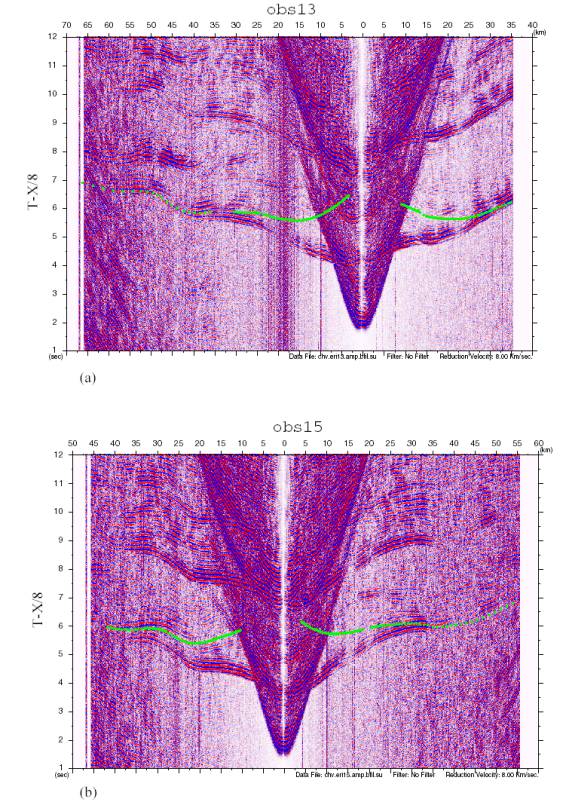
Fig. 3: Seismic record sections for OBSs 13 and 15 on
Line 3. Green lines are theoretical travel times obtained by the Vp structure shown
in Fig. 2. Vertical axis is the reduced time with 8km/s and horizontal axis is
the offset distance from the sources.
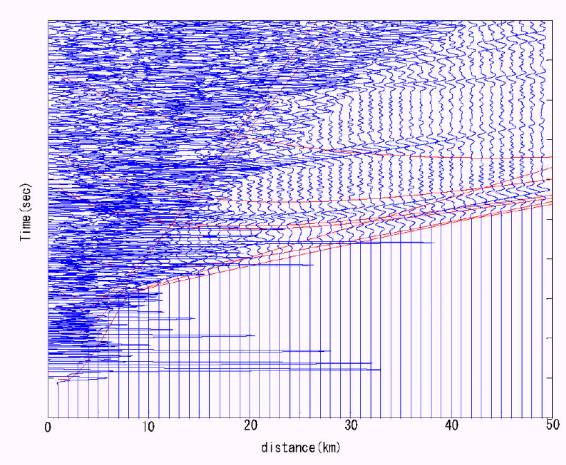
Fig. 4: Synthetic seismograms and theoretical travel
times for the flat layer similar to the structure shown in Fig 2a. PP reflected arrivals are followed by
first arrivals. Vertical axis is the reduced time with 8km/s and horizontal
axis is offset distance from source.
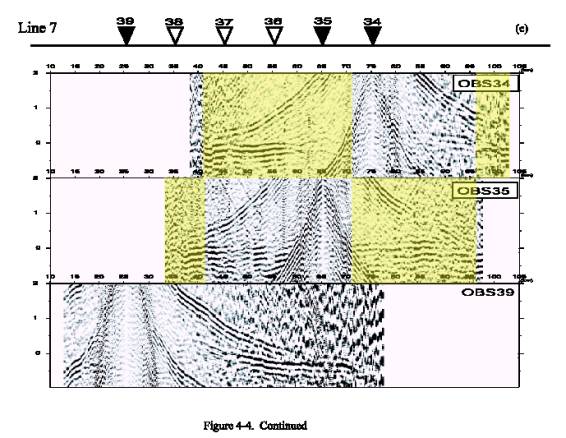
Fig. 5: Move-out Record Sections of three OBSs (▼)
by corrected by PP reflection times to the plate boundary on Line 7 (the most
westward line) shown in Fig. 1. Horizontal axis is distance to the reflection
point. 0-second corresponds to the plate boundary. Up is shallow.
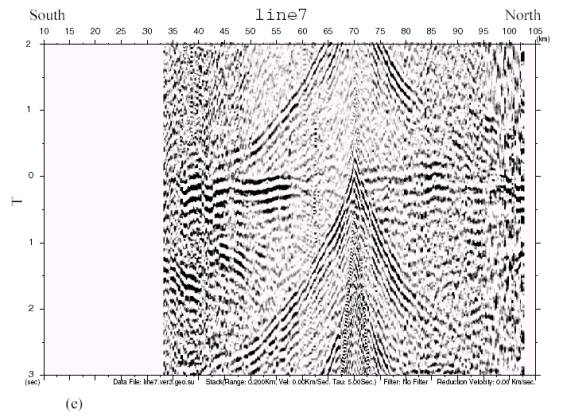
Fig. 6: Composite Move-out Record Section for Line
7. 0-second corresponds to the plate boundary. Up
is shallow. Horizontal axis is location of reflection point.
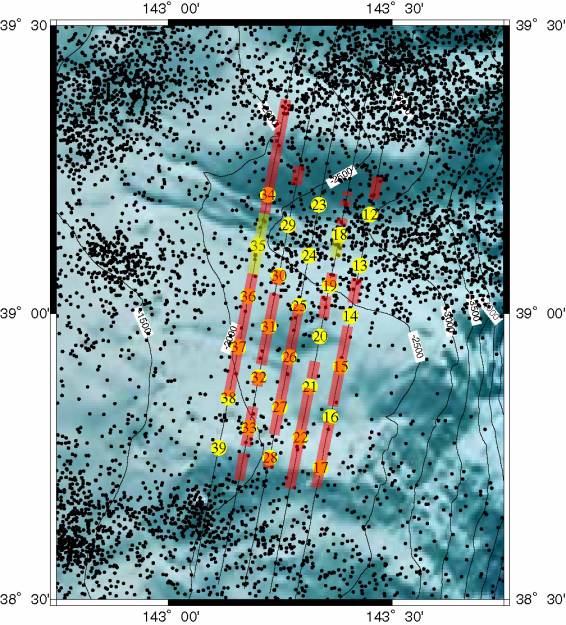
Fig. 7: Relation
between high reflectivity (red part) and low seismicity. Note that high
reflectivity zone fits to the aseismic zone.