How can we focus targets on the
conduit?
The geometry of the conduit is a "dike (or
plate) shaped", with the length as large as several hundred meters
and the thickness of 10-20 m. Although conduits are often visualized
as pipes, this is in fact a misconception. Exposed sections of arc
volcanoes show that even at shallow depth the feeders are plate-like
rather than pipe-like. The horizontal length of the Unzen conduit is
several hundreds m. Drilling is scheduled normally to the dike. The
probability to hit the conduit is very high.
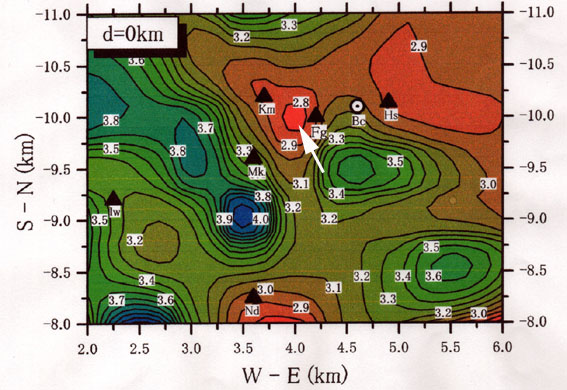
The above figure shows seismic
tomography below the summit area of
Unzen volcano. Inversion was carried out using the result of a
seismic experiment in 1995. Numbers represent seismic velocity (P
wave) in km/s. The white arrow indicates the location of conduit
piercing into the plain of sea level. Hs is the top of lava
dome.(@copyright of K. Nish, Kyoto University)
In order to determine the detail position and
structure of the conduit, the seismic experiment using vibrators was
carried out along the survey line passing the volcano in a SN
direction in December 2001. The analytical result suggested a portion
with a lower seismic reflection, suggesting the position of the
conduit about 2 km west of the dome and at the depth of the sea
level. Seismic reflections suggesting the base planes of the Unzen
volcanic graben and the head of pressure source deduced in the ground
leveling survey during eruption were also detected.
Experiment image: Seismic experiment to find the precise position of the
conduit, scheduled in the end of 2001. Conduit shown here represents
only the thickest part.
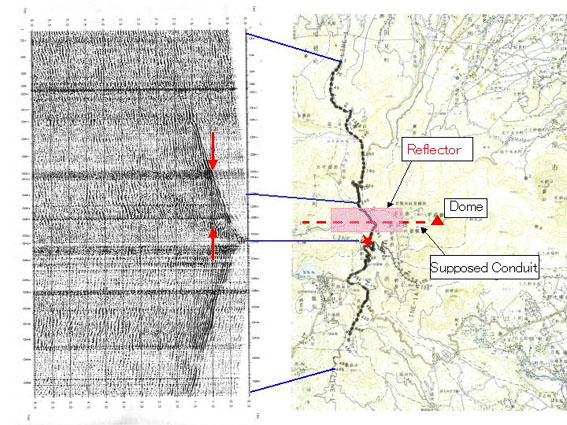
Result (1):
Seismic record of the exploration (horizontal axis is time in s,
covering 0 to 6 s) (left) and the survey line (about 10 km long) on
the map (right). The seismic exploration was carried out in December
2001, in order to detect the detail target (conduit). A star in the
middle of the survey line shows the location of vibrator (seismic
source). Arrows plotted in 1 s (about 1 km depth) in the seismic
record indicate the existence of a reflector, whose estimated
horizontal distribution is shown in the map (shaded area). The area
confirmed the possible conduit site determined already by seismic
tomography (Nishi et al., 2000). The precise target can be focused
through further analysis of the data obtained in geophone networks
with 25 m-intervals.(@copyright of Inst. Seis. Volc., Kyushu
University)
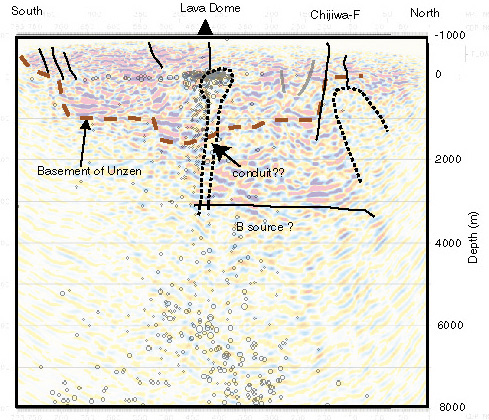
Result (2) (interpretation): seismic depth-section in NS direction showing the
cross section of the magmatic conduit, obtained after the migration
procedure. Circles are earthquakes during eruption. (@copyright of
Inst. Seis. Volc., Kyushu University)
Return to main
page
Return to the previous
page