Constraining the source location of the 30 May 2015 (Mw 7.9) Bonin deep-focus earthquake using seismogram envelopes of high-frequency P waveforms: Occurrence of deep-focus earthquake at the bottom of a subducting slab

Geophysical Research Letters, 43, 4297-4302, doi:10.1002/2016GL068437

Shunsuke Takemura1,2, Takuto Maeda1, Takashi Furumura1 and Kazushige Obara1
1Earthquake Research Institute, the University of Tokyo
2National Research Institute for Earth Science and Disaster Resilience

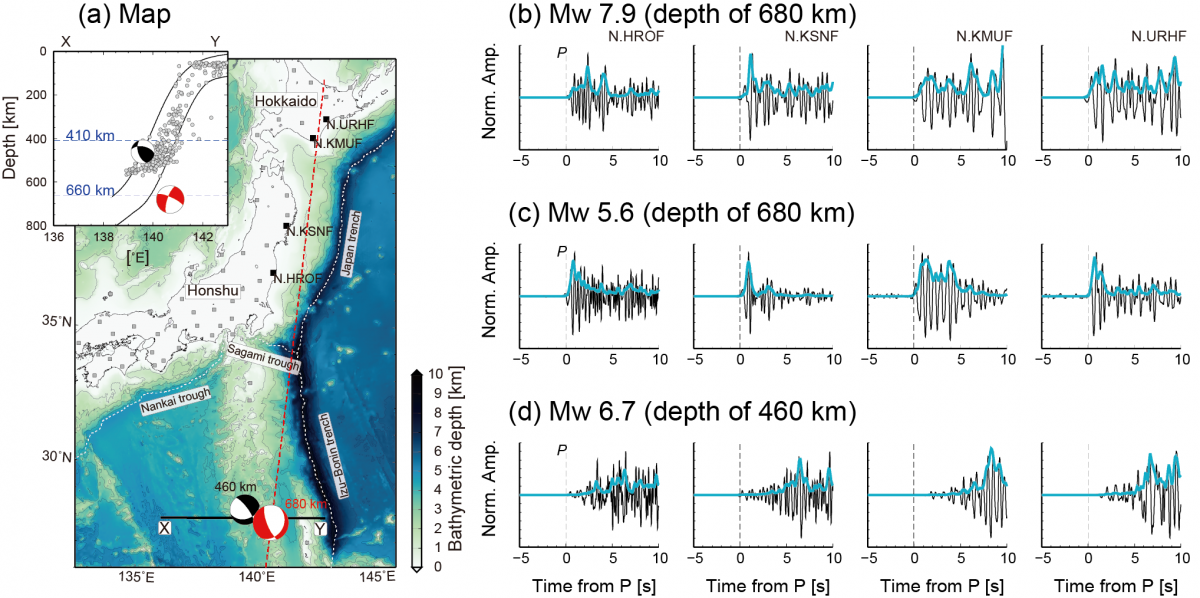
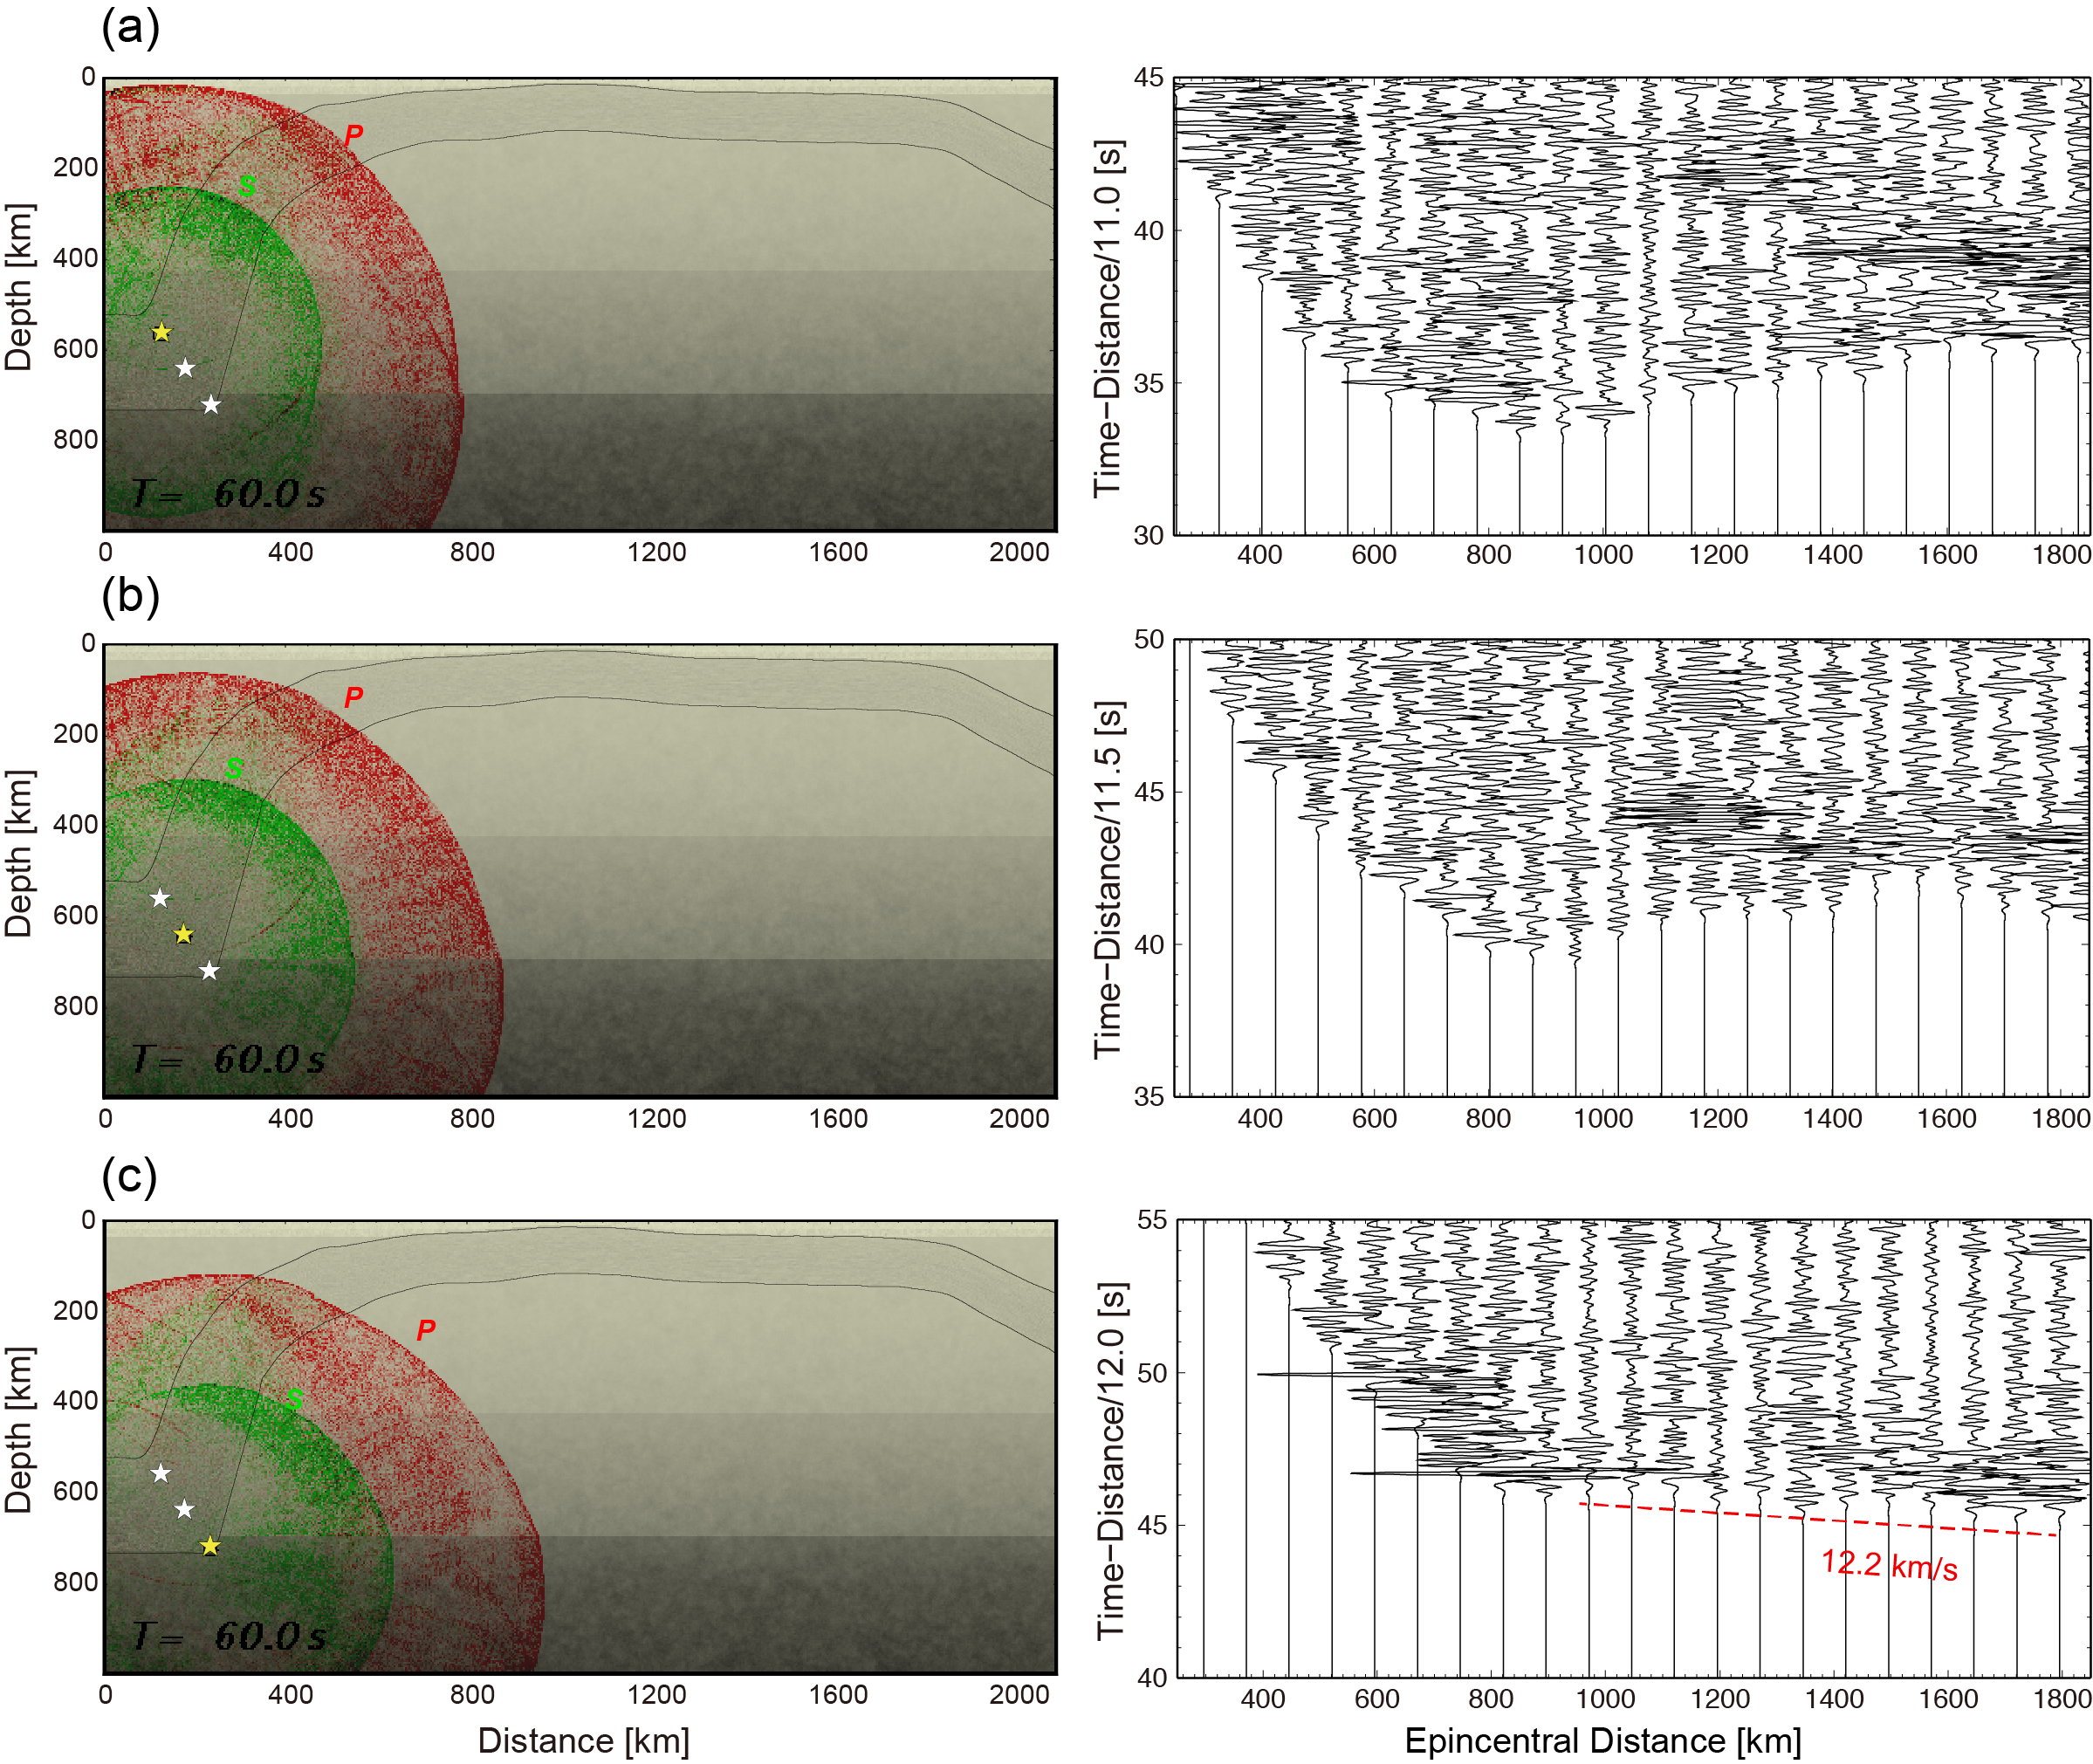
In this study, the source location of the 30 May 2015 (Mw 7.9) deep-focus Bonin earthquake was constrained using P-wave seismograms recorded across Japan. We focus propagation characteristics of high-frequency P wave. Deep-focus intraslab earthquakes typically show spindle-shaped seismogram envelopes with peak delays of several seconds and subsequent long-duration coda waves; however, both the mainshock and aftershock of the 2015 Bonin event exhibited pulse-like P-wave propagations with high apparent velocities (~12.2 km/s). Such P-wave propagation features were reproduced by finite-difference method simulations of seismic wave propagation in the case of slab-bottom source. The pulse-like P-wave seismogram envelopes observed from the 2015 Bonin earthquake show that its source was located at the bottom of the Pacific slab at a depth of ~680 km, rather than within its middle or upper regions.

Figure 1. (a) Map of F-net and epicenters around the northern Bonin Islands and a cross section showing seismicity along longitude-line 28°N from the JMA catalog. Observed P waveforms for the 2015 Bonin earthquake (b) mainshock, (c) aftershock, and (d) an earthquake at a depth of 460 km. A band-pass filter with a passed-band frequency of 1–8 Hz was applied and each trace was normalized to its maximum amplitude. Bold blue lines in b–d represent the smoothed seismogram envelopes of each trace.
Figure 2. Snapshots of the seismic wavefield and vertical-component ground velocity motion derived from FDM simulations. In each snapshot, P and SV wavefields are colored red and green, respectively, and are generated from sources at depths of (a) 530 km, (b) 610 km, and (c) 680 km (denoted by stars). Yellow stars represent the assumed source depths for each individual simulation.

Acknowledgements: We used the F-net/Hi-net waveform data and the MT solutions from the F-net provided by the National Research Institute for Earth Science and Disaster Resilience, Japan (NIED). We also used the unified hypocenter catalog provided by the Japan Meteorological Agency (JMA). Bathymetric depth data was obtained from ETOPO1 [Amante and Eakins, 2009]. The large-scale 2D simulations were conducted on the Earth Simulator at the Japan Agency for Marine-Earth Science and Technology (JAMSTEC). Generic Mapping Tools [Wessel and Smith, 1998] was used for making figures.