On 6th September, M6.7 earthquake (according to JMA) occurred in Iburi, Hokkaido, Japan.
*All figures/pictures/movies should be credited as: “Earthquake Research Institute, The University of Tokyo” when cited.
September 8, 2018 The 2018 Hakkaido Eastern Iburi Earthquake (Ver 2)
updated:2018/9/8/15:10
(Strong-motion seismology Group)
<Click to watch the movie>
Fig.1 Seismic wave propagation recorded on dense strong-motion networks (K-NET and KiK-net, NIED). Visualized image of the seismic wave propagation at 20s, 40s, 80s and 120s after the earthquake origin time. The red point indicates for the hypocenter, the spread of orange area indicates for the ground shaking spreading from the hypocenter (created from the data from 439 stations, downloaded at 14:05 PM on 8 Sept. Unavailable data from some observation stations such as at Hidaka area are excluded).
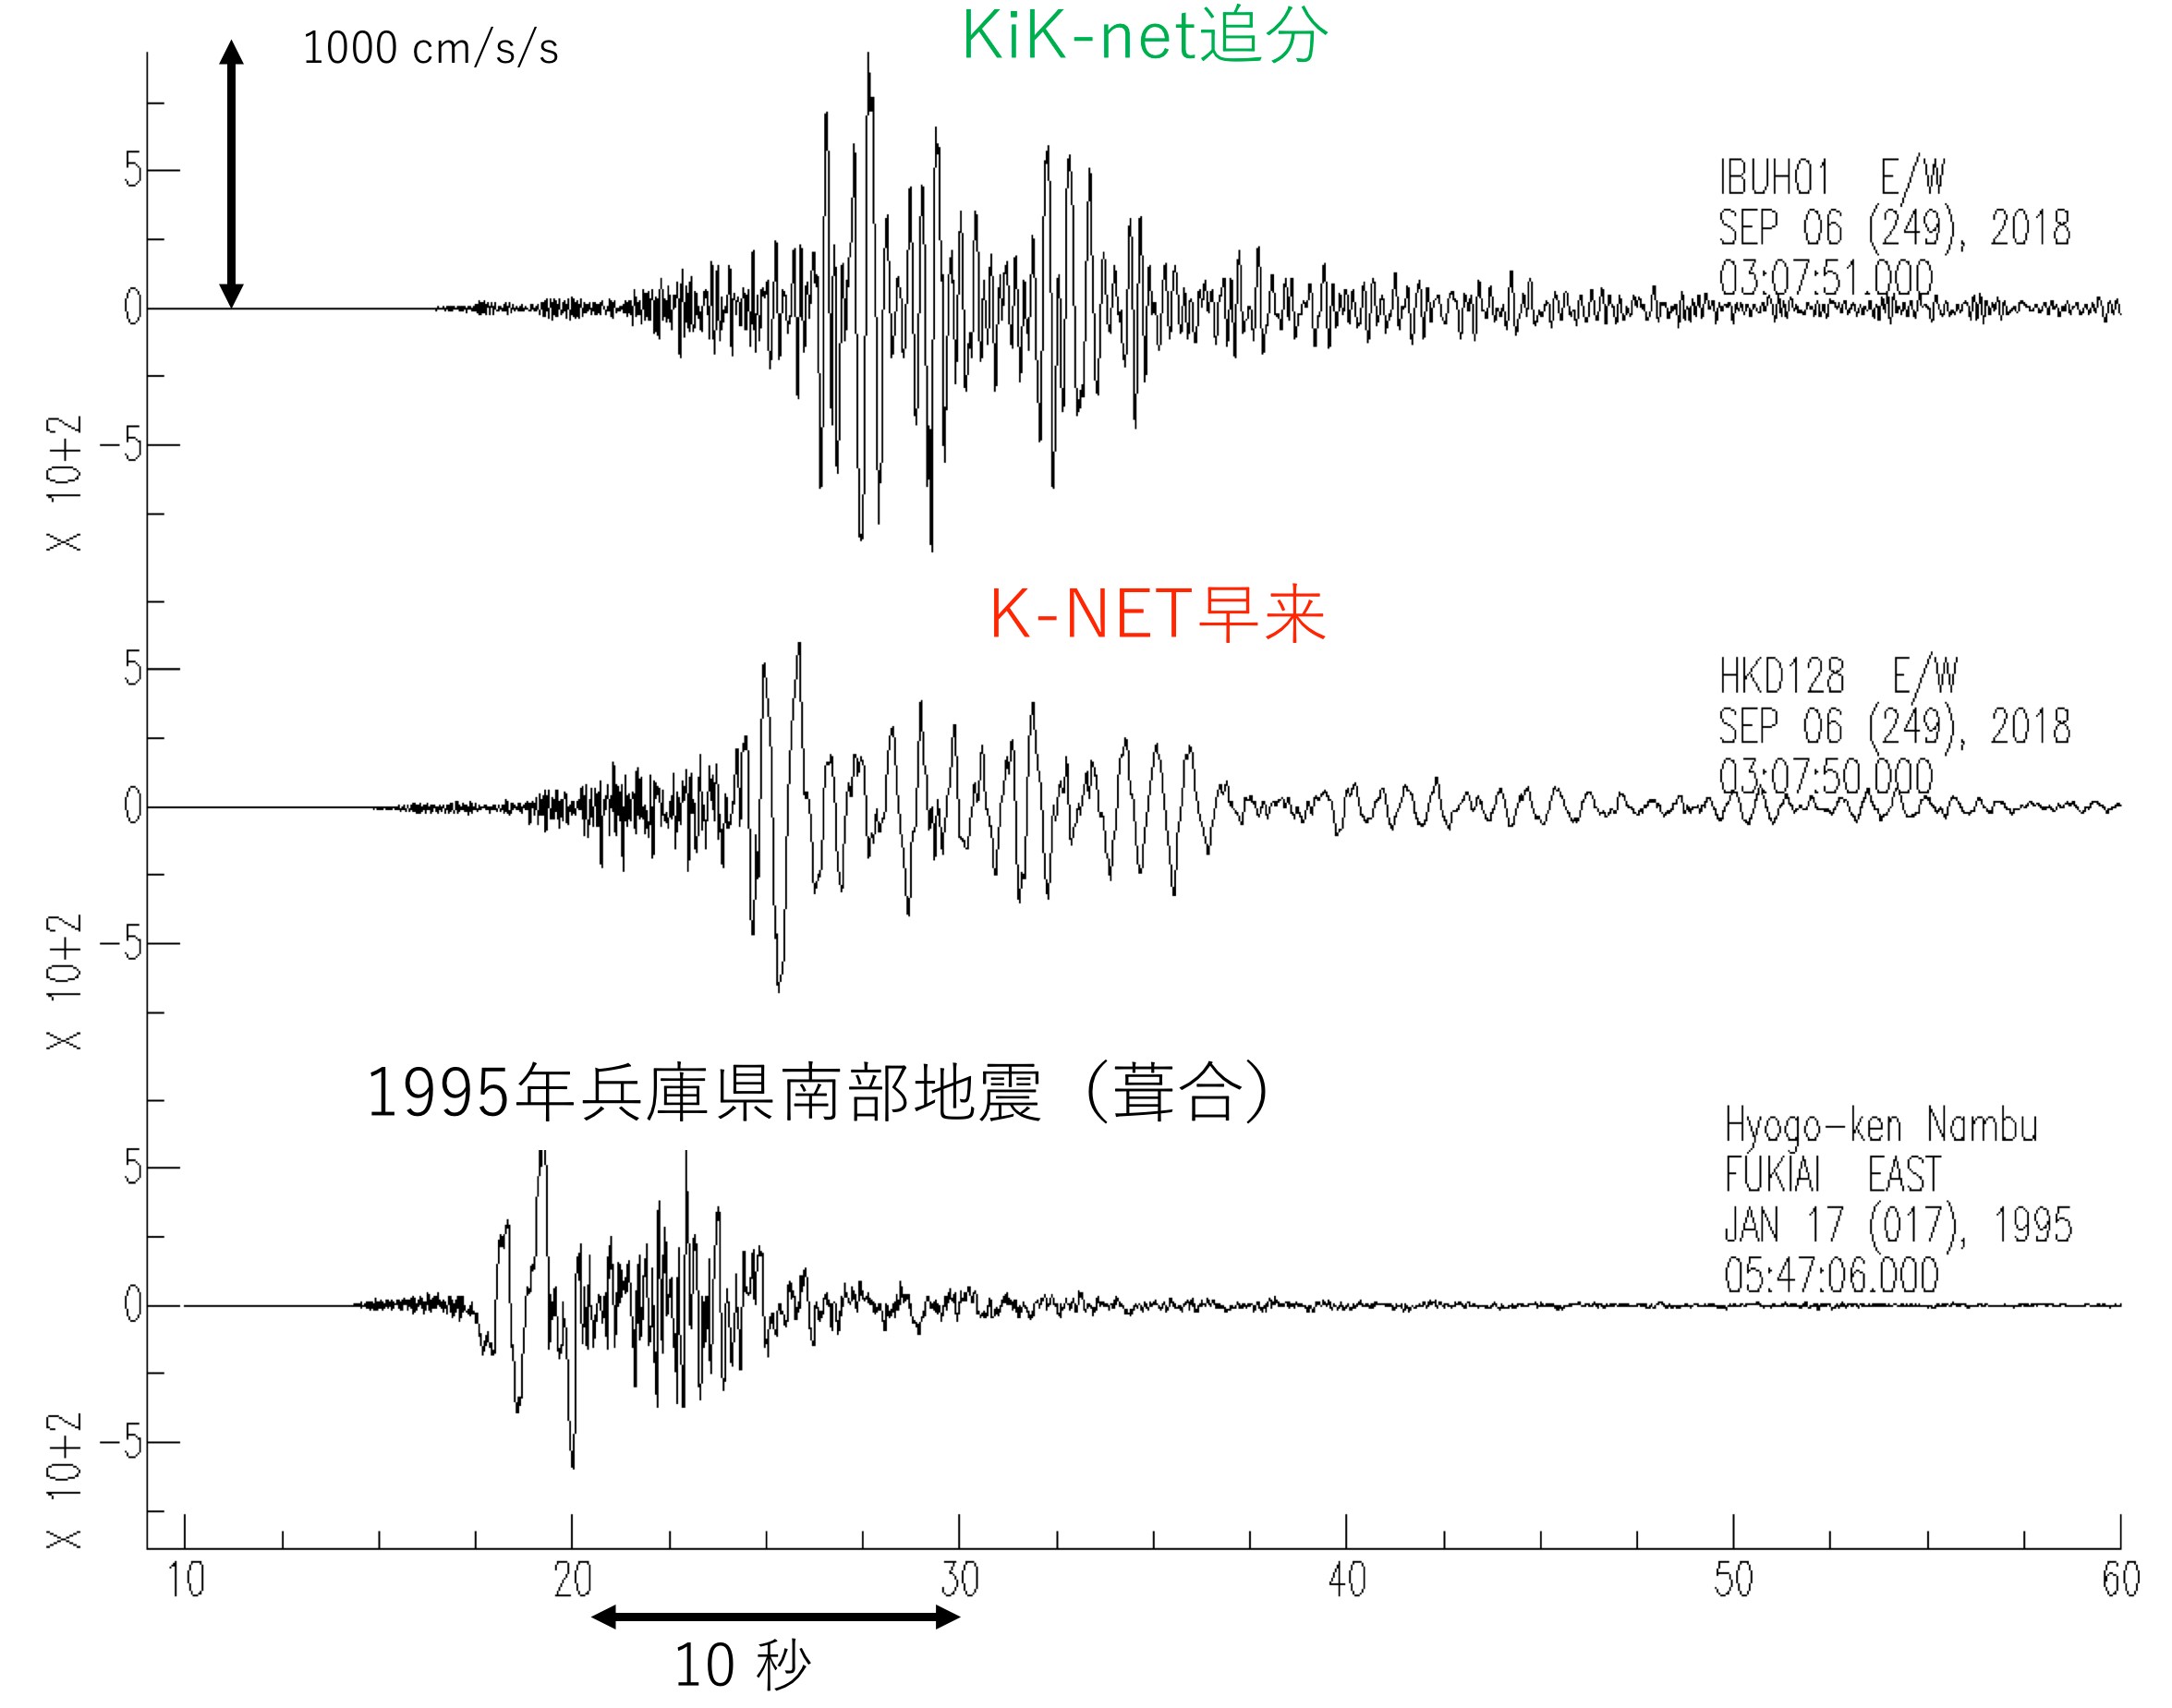
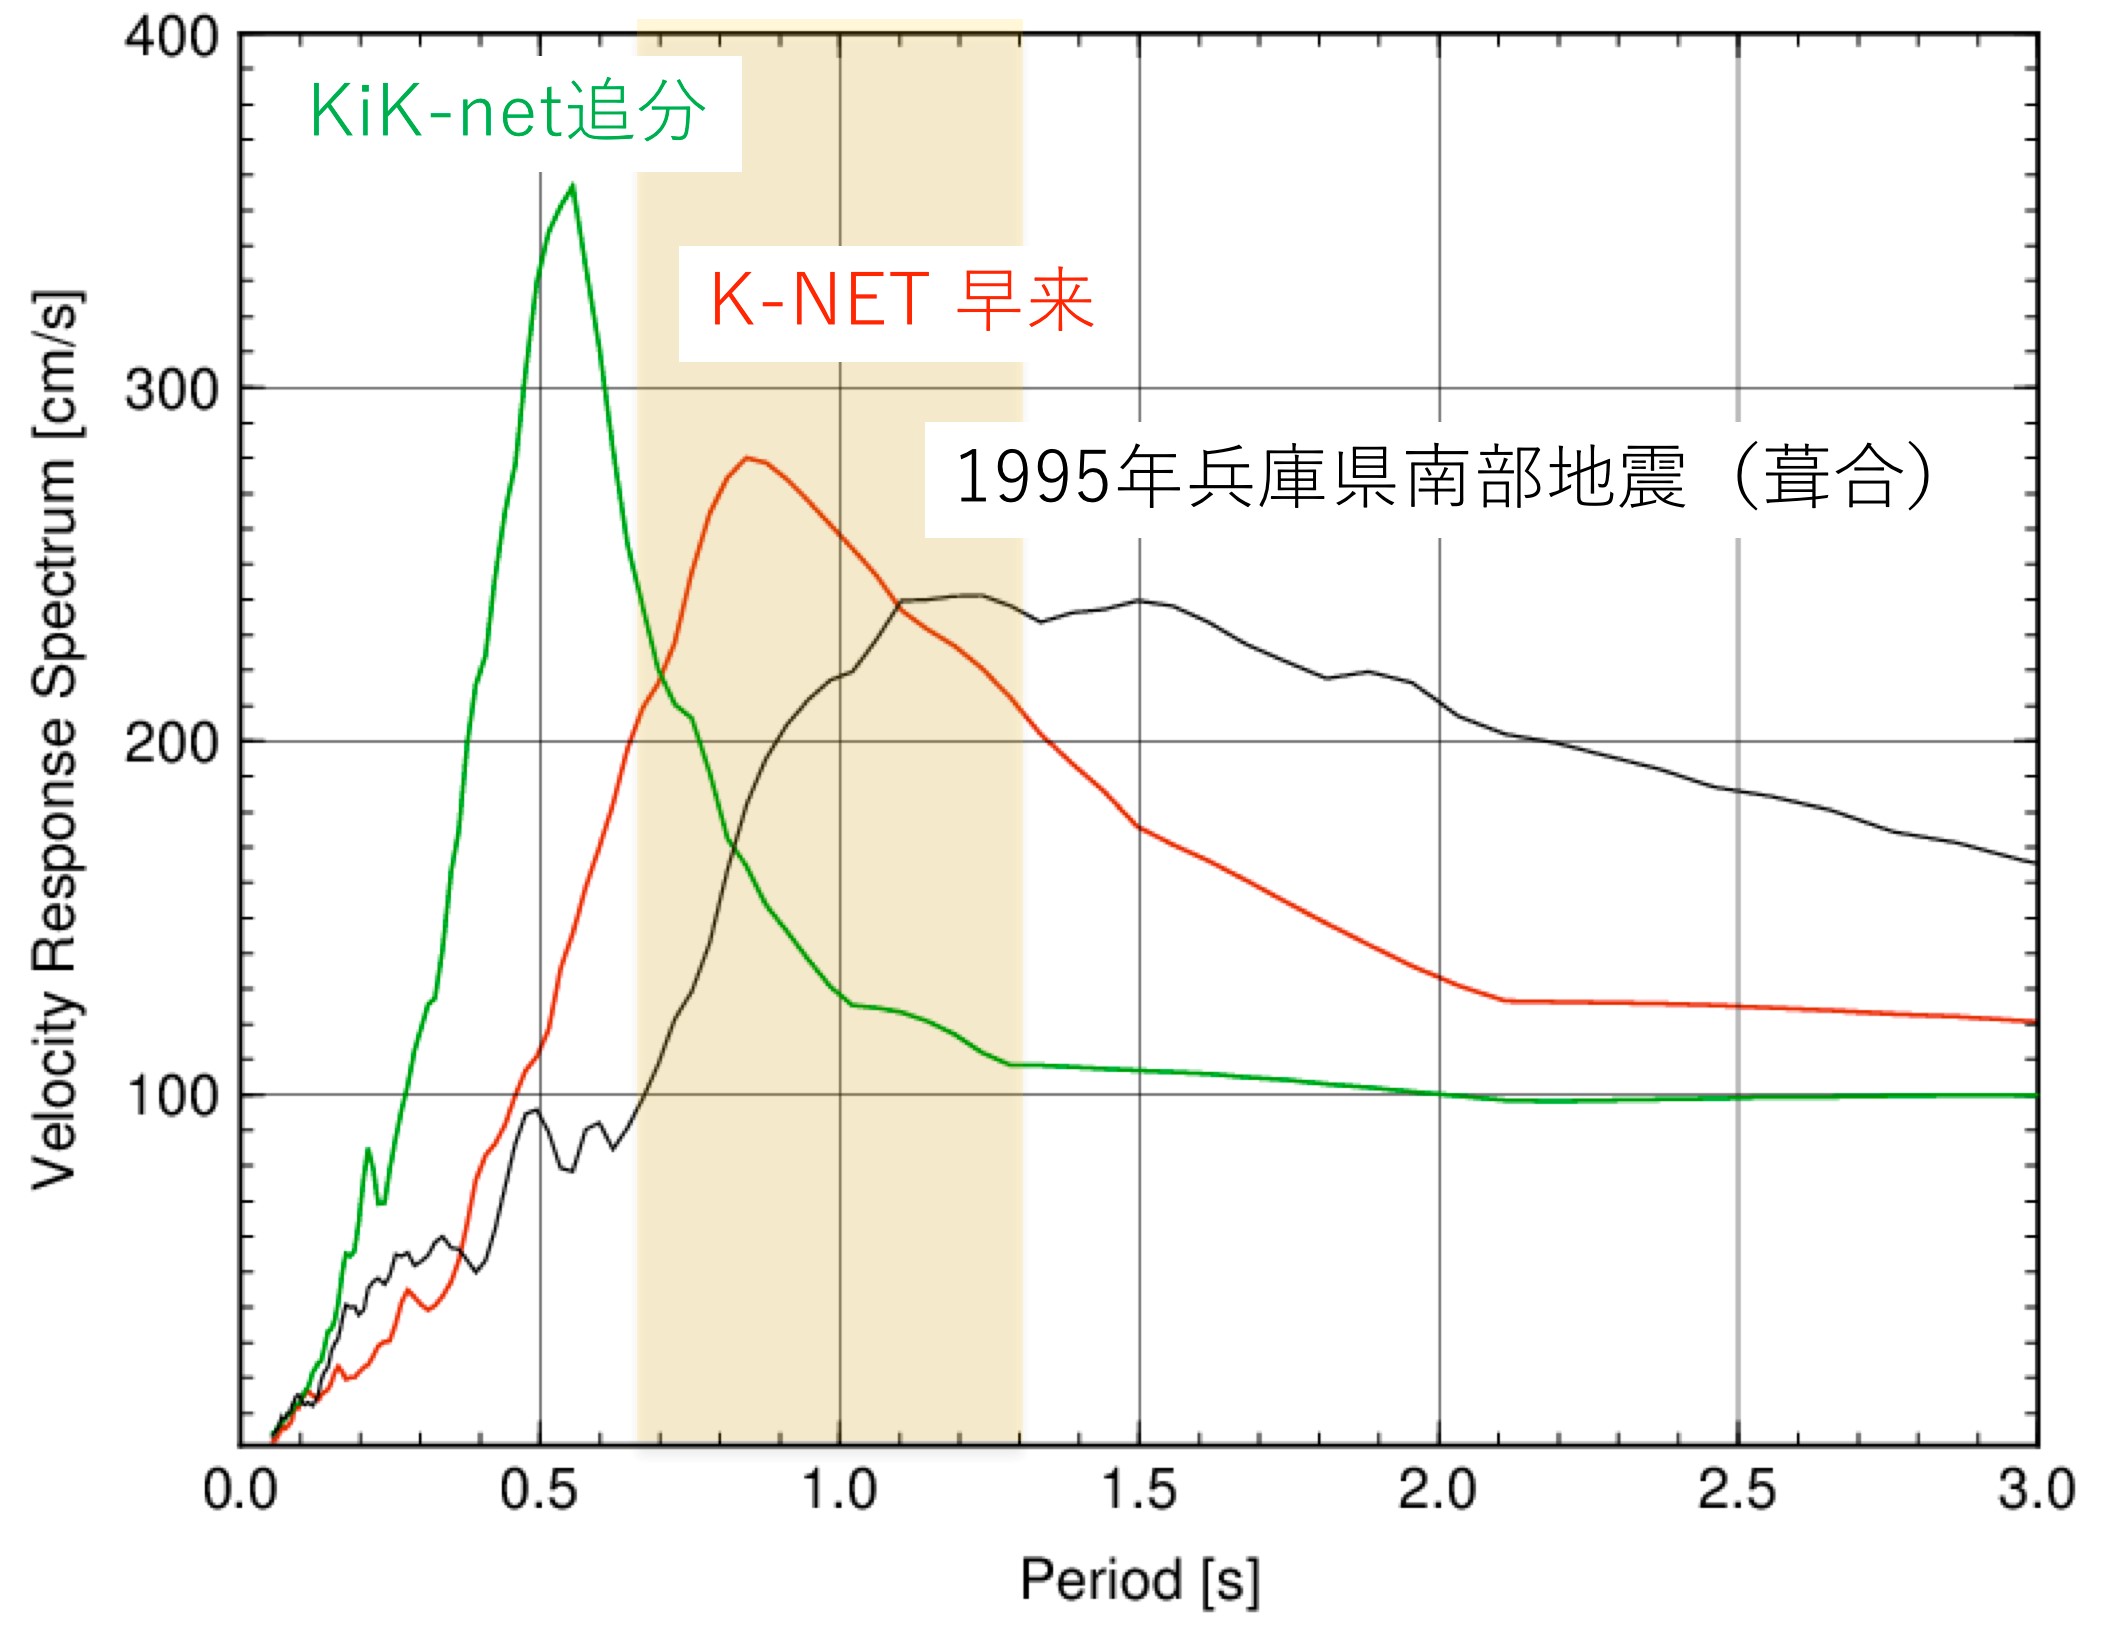
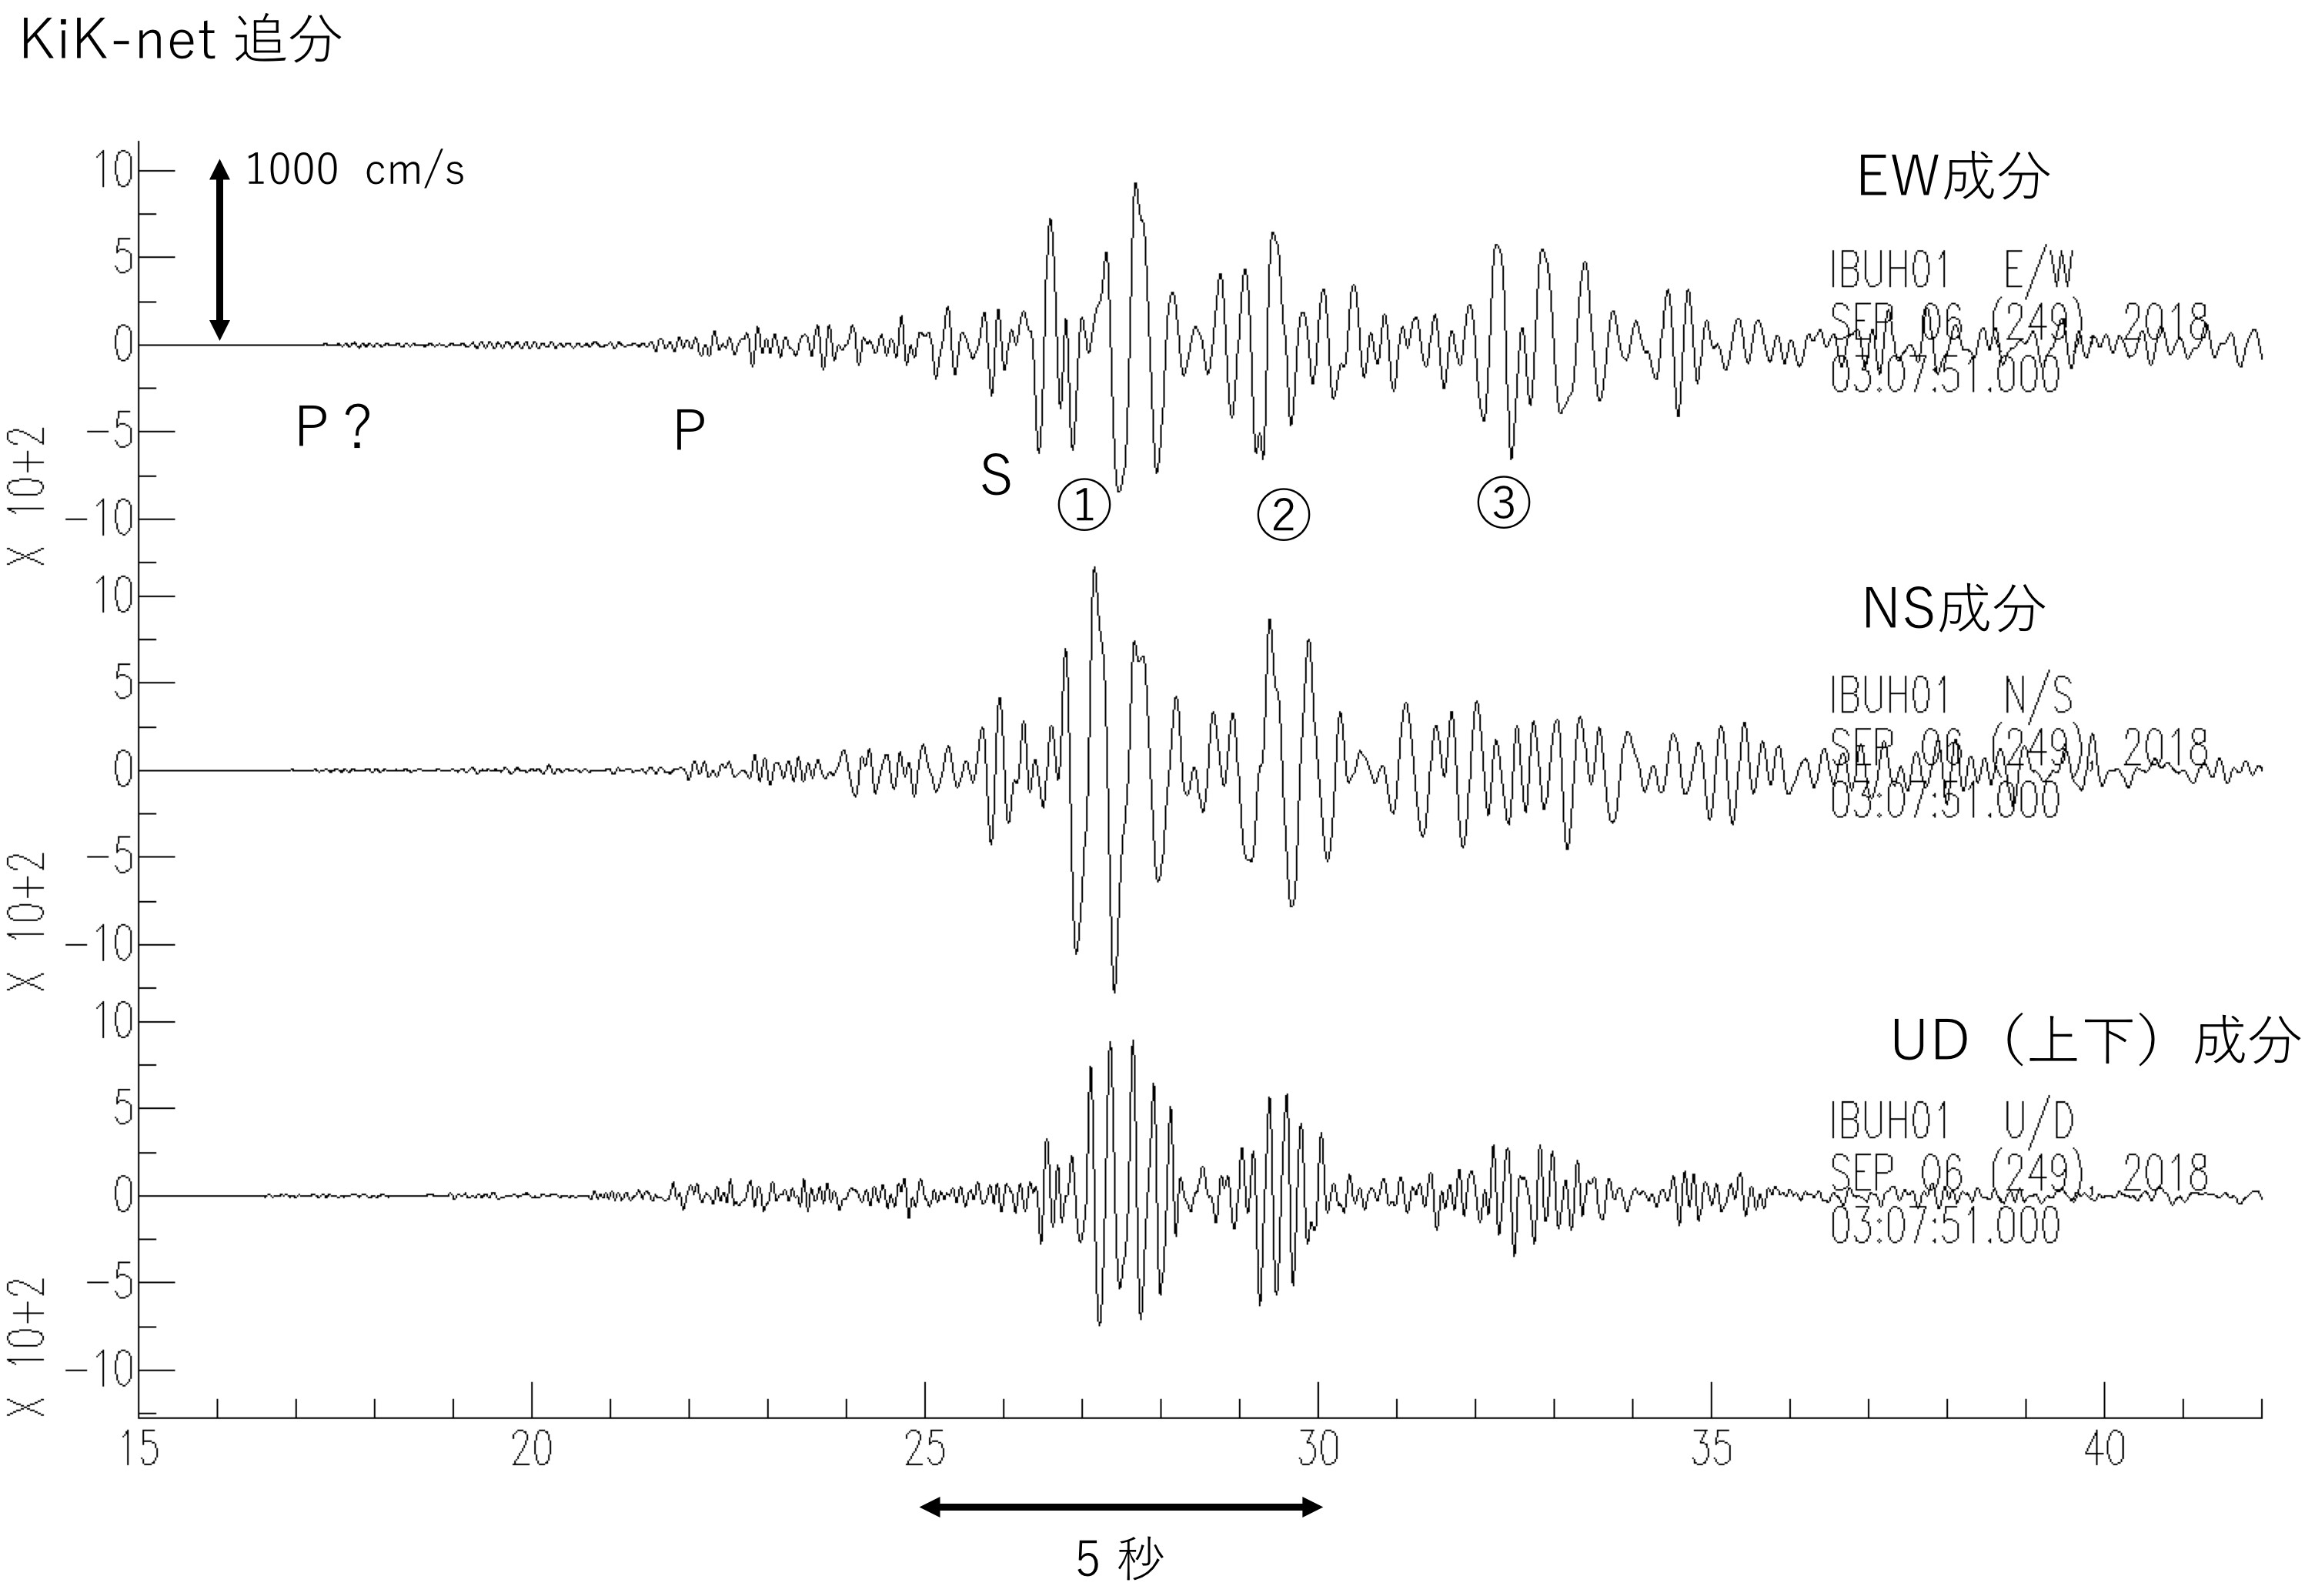
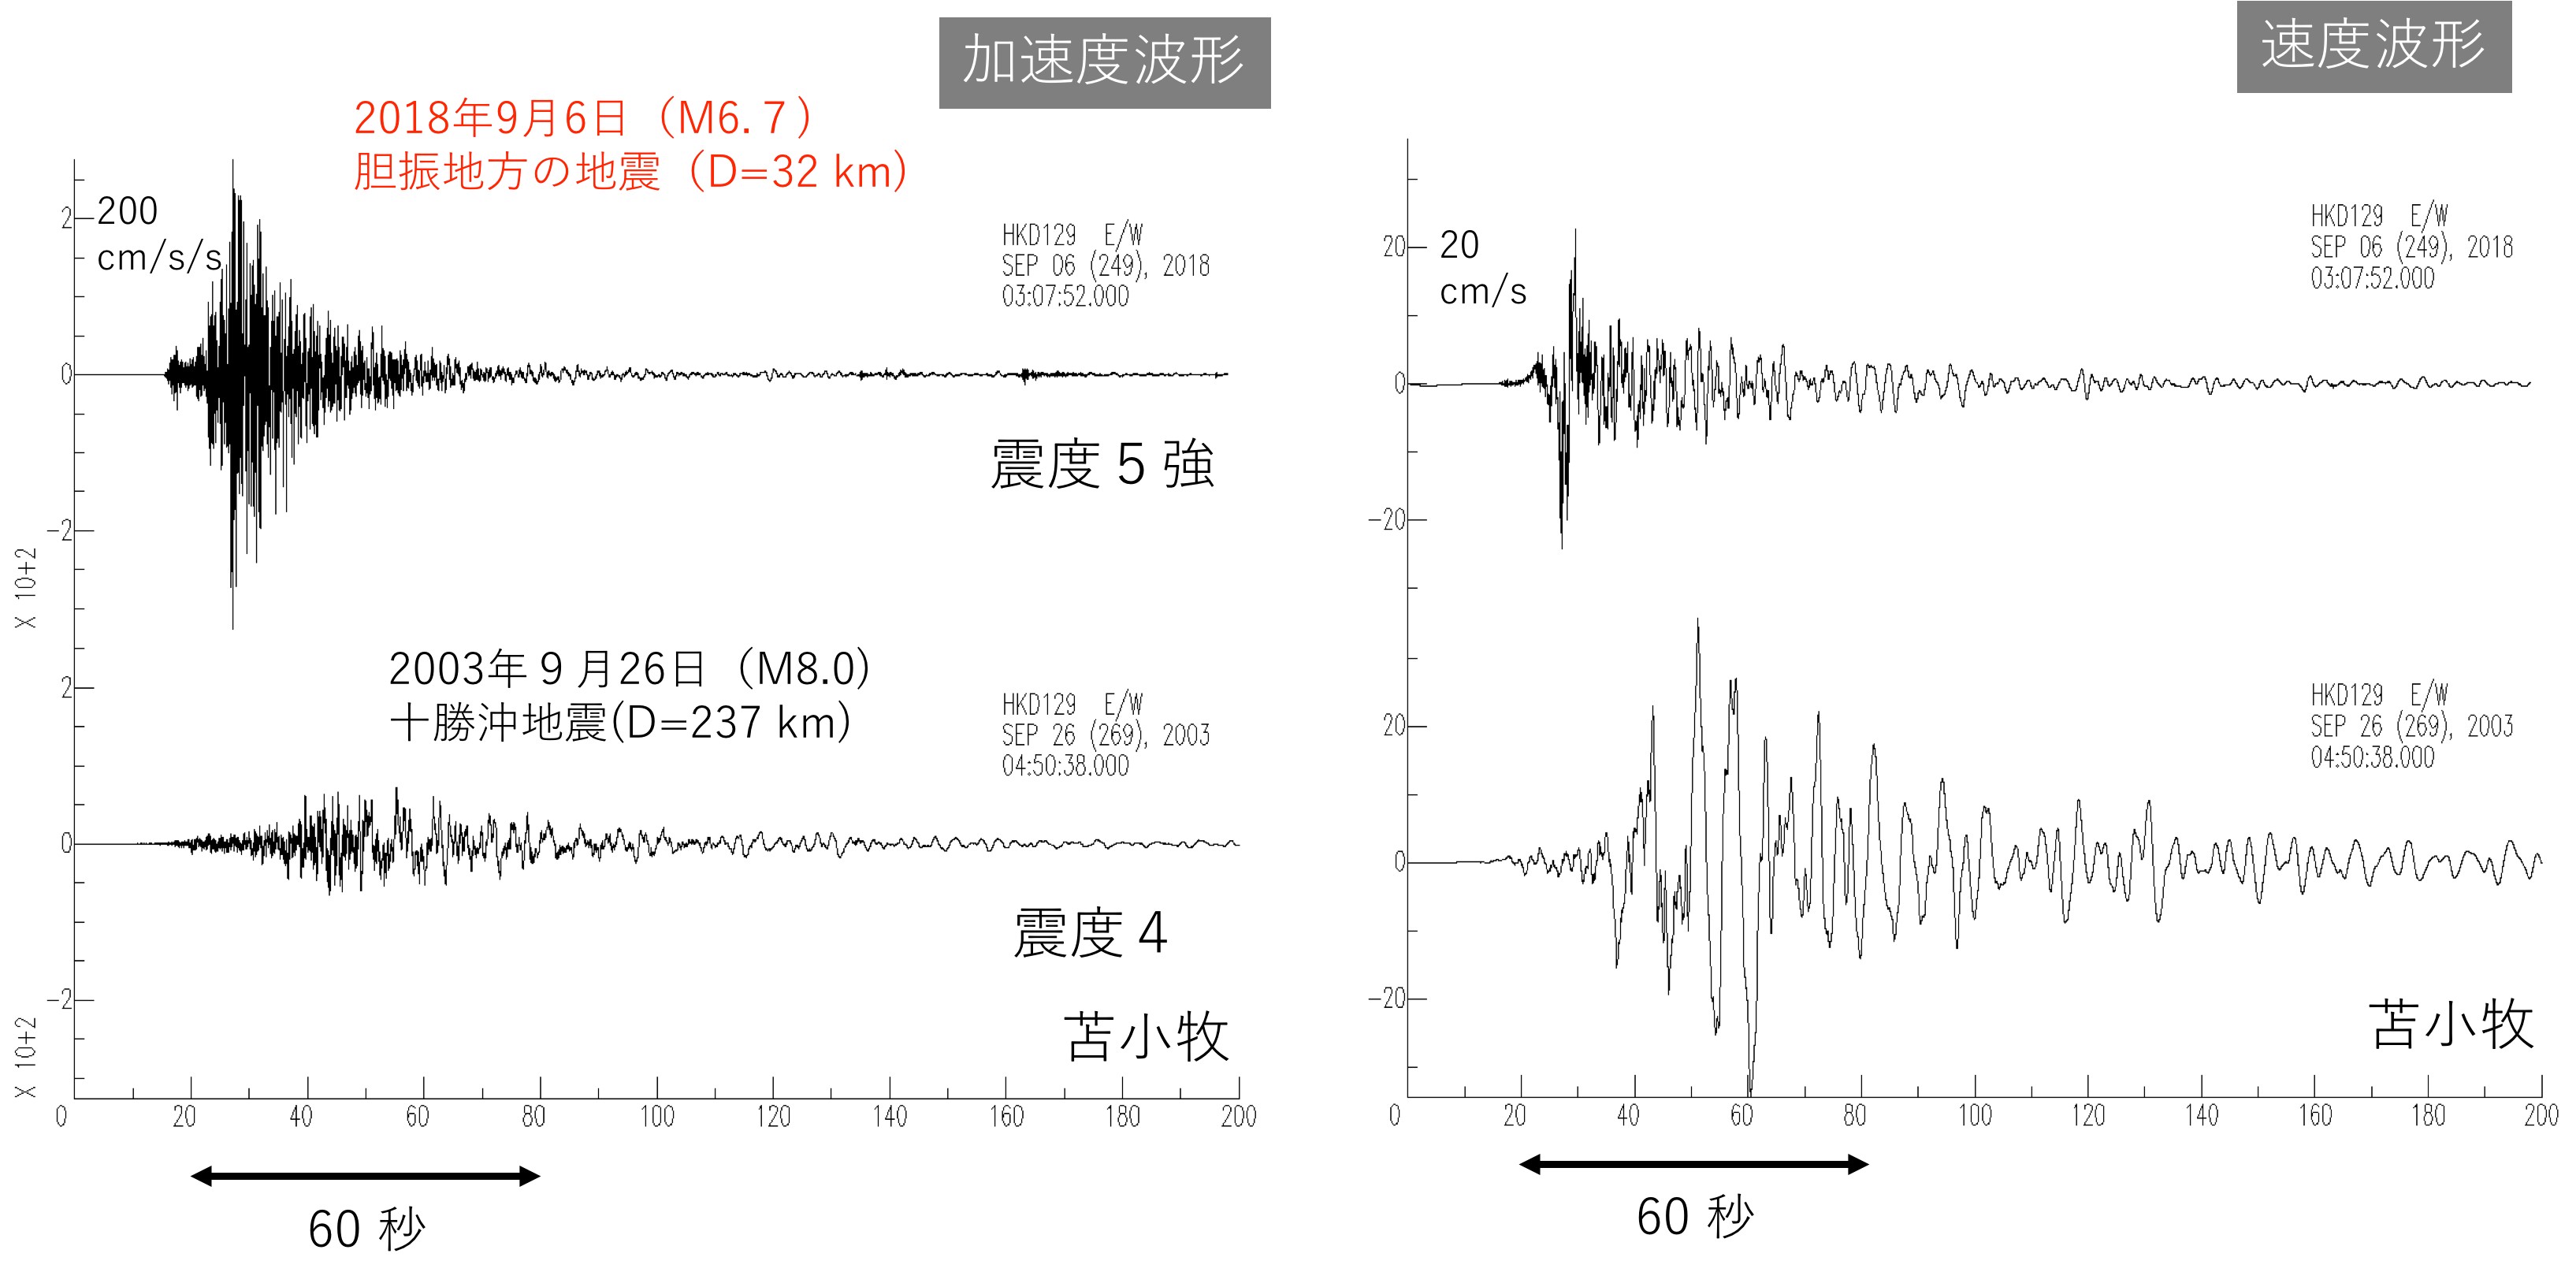
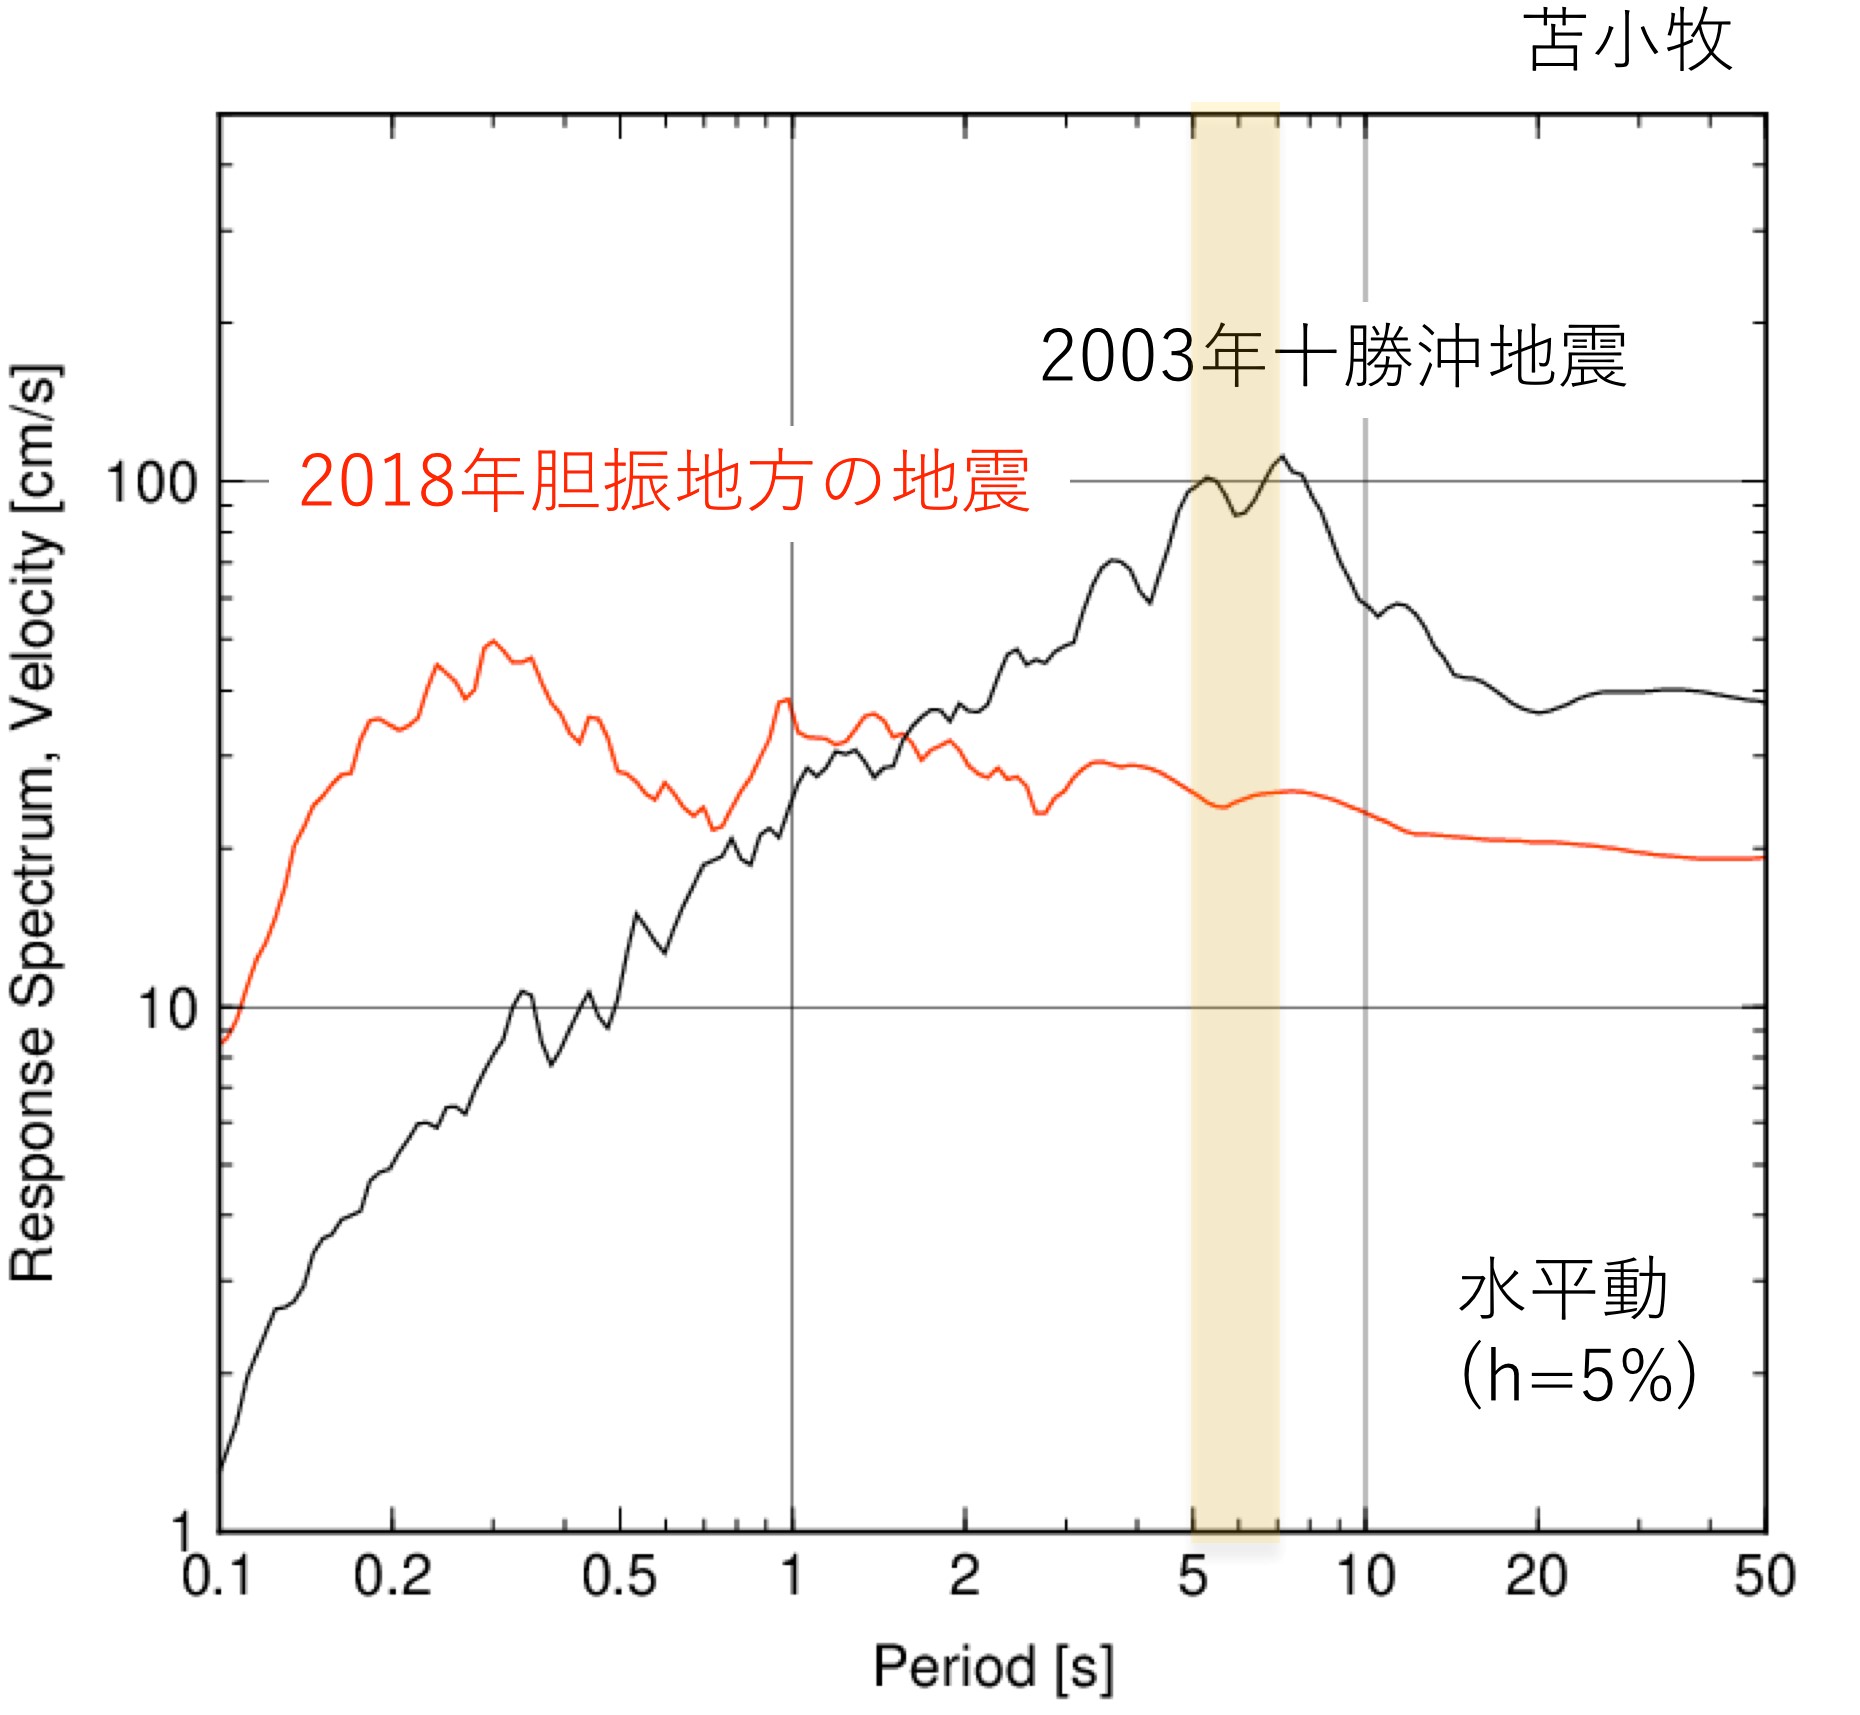
Fig.2 Comparison of the acceleration waveforms of the east-west direction of the two observation stations (IBUH01 Kik-net Oiwake and HKD128 K-NET Hayakita) close to the epicenter, and the waveform recorded at Fukiai in the 1995 Kobe (M7.3) earthquake. Because this earthquake occurred just beneath, the length of strong shake was relatively short time of about 10-20 seconds, but this large (M6.7) earthquake caused severe shake (>1000 cm/s/s) that exceeded the gravitational acceleration. Large acceleration may be due to epicenter being relatively deep (37km deep) to radiate high-frequency signals largely, and amplification of short period shaking by resonance with soft sediments. Such short-period signal is much notable at Oiwake (IBUH01), but at Hayakita (HKD128) shows relatively long period shake of about 1s. This slightly longer-period signal is similar to the shake recorded at Fukiai close to the fault of the 1995 Kobe earthquake.Fig3. We investigated the influence of strong earthquake shaking by using a velocity response spectrum, using the records at Oiwake and the Hayakita shown in Fig2. The horizontal axis of the figure shows the natural period of the structure, and the vertical axis shows the strength (response) by which the structure with its natural period is shaken by the ground motions caused by the earthquake. We can see that the shake of very short cycle (0.5-0.6 seconds) at Oiwake station (green line) caused large effect (>350 cm/s)to structures of about 0.5second natural period, which means that it had a power to severely shake small structures. This large, short-period ground motions that and continued for certain period of time might have large effect to cause landslides and liquefactions. On the other hand, slightly relaxed longer-period ground motion at Hayakita has large influence (> 280 cm / s; orange hatched part) on much larger-scale structures that has natural period of about 1 second which corresponds to wooden houses. The derived velocity response around 1 second was about the same level as of the 1995 Kobe earthquake where many wooden houses collapsed.Fig4. Enlarged ground motion records of the Oiwake station (distance from epicenter: 24km) show a strange wave, other than P and S waves. This figure shows the three component ground velocity records (from top: EW, SN, vertical). There is a small tremor (P?) before P wave, maybe a small earthquake occurred before this earthquake. Moreover, there are at least three sets of S phases after the S wave (marked 1,2,3). This sets of S phases might be created by S waves repeatedly reflected in thick sedimentary layer of the Yufutsu Plain.Fig.5 In this earthquake, JMA reported the Shaking intensity of the long-period ground motions of rank 4 (maximum grade) in the southern part of Ishikari district and it was 3 at the Tomakomai. At Tomakomai, during the 2003 Tokachi-oki earthquake (M 8.0) a large oil tank was damaged and fired due to the resonance to long-period ground motions at period around 6 seconds. This figure compares the difference of long-period ground motions observed at Tomakomai (K-NET HKD129) from the current earthquake and 2003 Tokachi-oki earthquake. The acceleration waveform shown on the left shows the current earthquake of close distance (32 km) created overwhelmingly intense shaking, however, the velocity waveform that emphasize the long period component shows much weaker long-period ground motion than the 2003 Tokachi-oki earthquake.Fig.6 Comparing the velocity response spectrum of the observed ground motions at Tomakomai for the current and the 2003 Tokachi-oki earthquake. It is demonstrated that the intensity of the long-period motion with a period of about 6 seconds (orange hatched part), which is strongly amplified by the thick sedimentary layer of the Yufutsu plain and damaged the oil tank by resonance, was less than 1/4 of that of the 2003 Tokachi-oki earthquake (black line).