4-1. Researches for
Earthquake Prediction
Our recent researches have
revealed the characteristics of the places that have potential for generating
earthquakes. In particular,
progress in the studies on the interplate earthquakes is remarkable: earthquake
data analyses, laboratory experiments and numerical simulations show that large
earthquakes are caused by ruptures of asperities where two plates are strongly
coupled in the interseismic periods.
Moreover, large episodic creep events (very slow events) have been found
also. It is expected that such a
slow event will cause a stress concentration and accumulation on a nearby
asperity and the asperity will eventually rupture to generate a large
earthquake. Thus, we believe that
the ruptures of asperities (i.e., earthquakes) can be predicted to some extent
by monitoring the slow events.
Before making prediction, however, we have to know the nature of the
asperities and slow events in detail.
Intensive studies for this purpose are now going on.
4-1-1. Study of the relation
between seismic process and physical properties of the subuction plate boundary
in the forearc slope of the Japan trench
By a seismic experiment in 1996, we found intense PP reflections from
the subduciton plate boundary at 10km below seafloor in the aseismic region
existing in the forearc slope of the Japan trench(green ellipsoid in Fig. 1).
To confirm this observation in whole aseismic region, we carried out another
seismic experiment in 2001. As the result, we confirmed the previous findings. Composite
record sections for Lines 3 and 4 (Fig. 2) show intense PP reflections from the
plate boundary at 0-sec. Records from Line 3 to Line 7, we can conclude almost
the same result as before. Seismic characteristics and variety of interpolate earthquake
generations may be controlled by physical properties at the plate boundary.
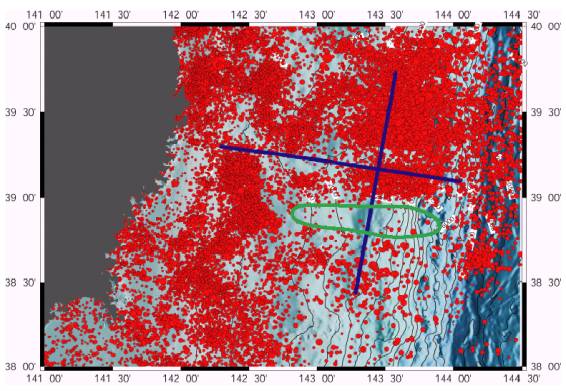
Fig. 1. Epicenters with M>3 and depth<100km
during 1985 and 1989. Green ellipsoid : aseismic region.
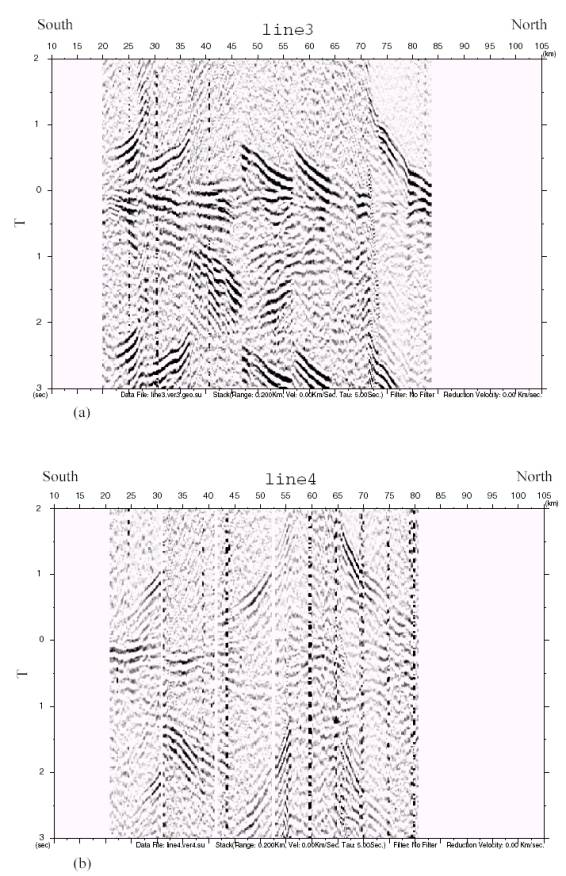
Fig.2. Composite move-out record section
along Line 3 (N-S blue line in Fig. 1) and Line 4 of 20km west of Line 3. Vertical axis: observed travel time –PP
reflected travel time at plat boundary. 0-sec : plate boundary. Horizontal
axis: location of refection.
4-1-2. Plate boundary at the
Tokai region
The Philippine Sea plate is
descending into the mantle beneath Japan with a velocity of several cm/year at
the Tokai and Nankai trough region.
Large earthquakes with magnitudes of about 8 have repeatedly occurred
along the Nankai trough where the Philippine Sea plate is descending beneath
central Japan. The Tokai region is
one of the very important fields for understanding the mechanism of large
interplate earthquakes. The geometry of the subducting plate is one of the very
important parameters in the numerical simulation, but has not yet been
determined well.
A joint seismic experiment
was conducted in the Tokai and central Japan area in August 2001 (Fig. 3) with
explosive sources by the Research Group for Seismic Expedition in Central
Japan, which is organized by universities, JAMSTEC(Japan Marine Science and
Technology Center), and other government organizations. A 261.6 km profile was
extended in N-S direction to traverse island-arc Japan from south coast (Iwata,
Shizuoka prefecture) to north coast (Hakui, Toyama prefecture). We put 391 seismic stations along the
survey line. Six explosive sources
were shot on the seismic survey line.
The objectives of the experiment are to know the large-scale structural
variation of island-arc crust across central Japan and to know the
configuration of the subducting Philippine Sea plate.
The most remarkable feature of the record sections is two clear later
arrivals observed in the long distance range for shot J5. J5 is the southernmost shot point. The
later arrivals are explained by the reflected waves at the upper boundary of
the subducting Philippine Sea plate by an analysis by the use of a ray tracing
method. The configuration of the subducting Philippine Sea slab was revealed. The reflection coefficient at the upper
boundary of the Philippine Sea slab is expected to be large because the
observed amplitude of the reflected waves are much larger than those of direct
waves. A detailed analysis with
amplitude data is necessary to know the acoustic-impedance contrast at the
boundary. The analysis of the amplitude and waveform data will reveal the
physical properties at the upper boundary of the subducting Philippine Sea
plate.
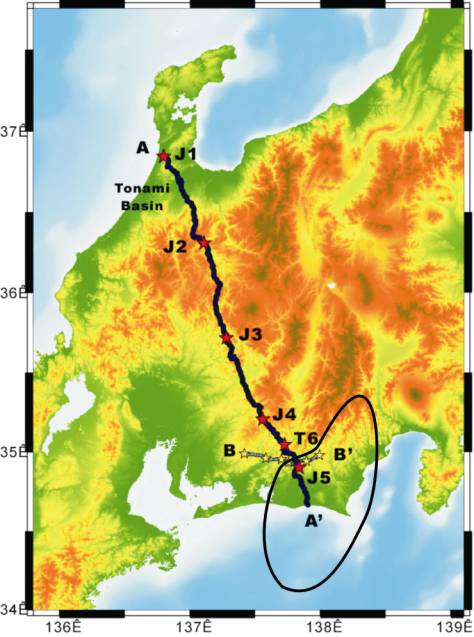
Fig.3. Location of the seismic profile line and expected fault plane of Tokai
earthquake.
4-1-3. Plate convergence and
long-term deformation in central Japan
Surveys by continuous Global Positioning System in and around Japan
revealed that the Amurian Plate collides with the North American Plate in
central Japan by ~2 cm/yr.
Long-term crustal deformation seems to be influenced mainly by this
collision although subduction of oceanic plates governs short-term elastic
deformation over the arc. Here we study
the long-term deformation field by carefully removing the short-term signals
inferred from a-priori plate convergence vectors and coupling strengths
predicted by a thermal model. The
obtained field shows that the change in velocities occurs along the longitude
135°~137°E, and there exist a relatively rigid block and zones accommodating
strains (Fig. 4). Characteristic
compressional deformation is found northwest of Izu due possibly to the
collision of the Izu-Bonin arc with Honshu. Plate convergence rate along the Nankai-Suruga trough is
considerably smaller in eastern parts, due partly to the transition from the
Amurian to the North American Plate of the landward side, and partly to the
motion of the Izu microplate relative to the Philippine Sea Plate (Fig. 5). This accounts for longer recurrence
intervals of interplate earthquakes in the Suruga trough where the Tokai
earthquake is anticipated to occur.
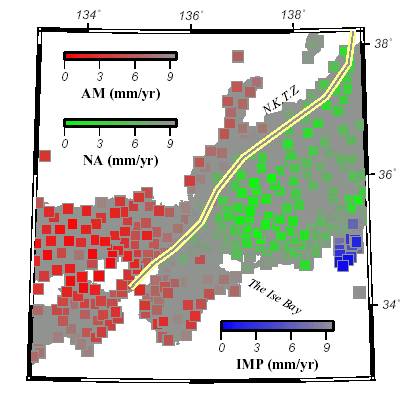
Fig.4.Departure from rigid plate motions
at GPS stations. One of red, green and blue colors was given to each GPS point to show which plate best explains its
long-term velocity vector. Vivid
colors show that the points move little with respect to that plate (numbers in the scale indicate velocities relative
to that plate). Niigata-Kobe Tectonic Zone [Sagiya
et al., 2000] is shown by a yellow broad line.
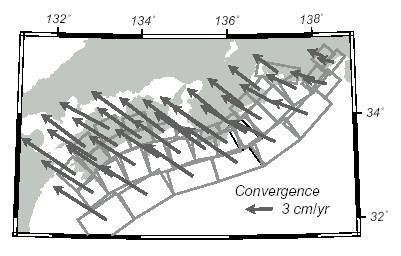
Fig. 5. Plate
convergence rates at the centers of the fault segments along the Nankai-Suruga
trough.
4-1-4. Distribution of asperities and seismic coupling
Waveform inversion has been carried out to derive the asperities
of recurrent earthquakes off Sanriku, Japan, region. It is obtained that the 1968
Tokachi-oki event mainly consists of two asperities (large co-seismic slip
areas), one of which is coincident with the asperity of the 1994 Sanriku-oki
event (Fig. 6). It is also shown that the seismic coupling in this region is
nearly 100%. In the southern Sanriku-oki region, there is no large earthquake,
indicating a very small seismic coupling. In off-Miyagi region, on the other
hand, a moderate seismic coupling is observed. It is also shown that episodic
slip often occurs in surrounding area of the asperities.
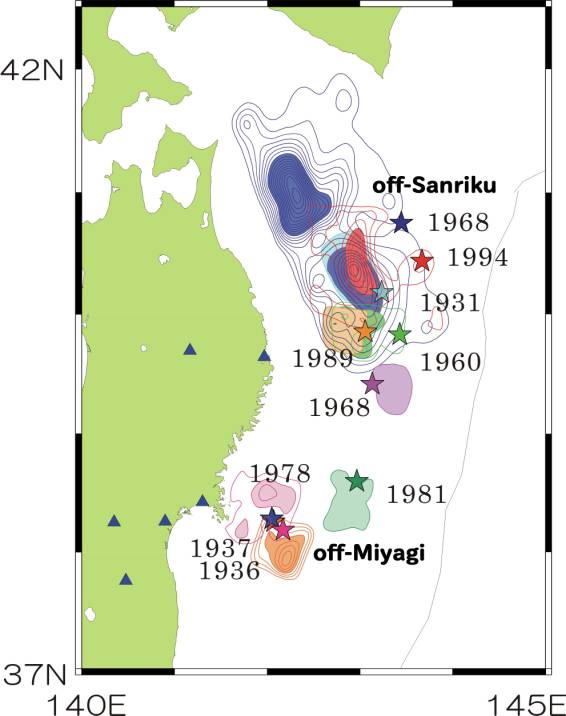
Fig. 6. Distribution of asperities in
Sanriku-oki region.
4-1-5. Numerical simulation of complicated slip behaviors on a
plate boundary
Recent studies of earthquake source processes and geodetic
observations indicate that sliding behavior on a plate boundary is nonuniform.
Seismic slip repeatedly occurs at asperities, significant aseismic slip follows
some large earthquakes in the adjacent area, and episodic aseismic slip events
occur at some regions. This suggests that frictional property on a plate
boundary is nonuniform. In order to understand nonuniform and unsteady sliding
behavior on a plate boundary, we conduct numerical simulation studies of
seismic cycles using laboratory-derived rate- and state-dependent frictional
laws.
We consider a simple
two-block model, in which Block 1 and Block 2 are connected by a liner spring
and driven by a slowly moving driver. We assume the friction parameters so that
Block 1 becomes unstable while Block 2 is stable. It is found that episodic
slow slip occurs when the friction parameters of Block 2 are near the stability
transition (Fig. 7). After the stress is reduced due to dynamic event, both
blocks stick during a period. When the stress is accumulated to a curtain
level, Block 2 starts slow slip. When the slip of Block 2 is approaching a
steady state slip, decaying oscillation in the stress and the slip velocity
occurs around the steady state values. The decaying oscillation approaching a
steady state could be a plausible generation mechanism of the episodic slip
which started in 2001 in the Tokai area.
Figure 8 shows an example of simulation result assuming a
more realistic continuum model, where two velocity-weakening friction patches
are embedded on the plate boundary which is loaded by a constant plate
velocity. In the figure, four snapshots of sliding velocity normalized by the
plate velocity are shown with colors, where yellow shows slow slip with slip
rate of about 1 cm/day and red shows seismic slip of about 1 m/s. An episodic
aseismic slip event with a slip duration of about 10 days takes place at one of
the patches. When the slow slip reaches the other patch, unstable (seismic)
slip starts. These simulations may explain various complicated observed
phenomena such as preslip, afterslip, episodic aseismic slip events (silent
earthquakes), and delayed rupture. It will be possible to estimate the spatial
distribution of frictional constitutive parameters by comparing the simulated
slip histories with observed data. Our goal is to forecast slip events through
numerical simulations with the estimated friction parameters.
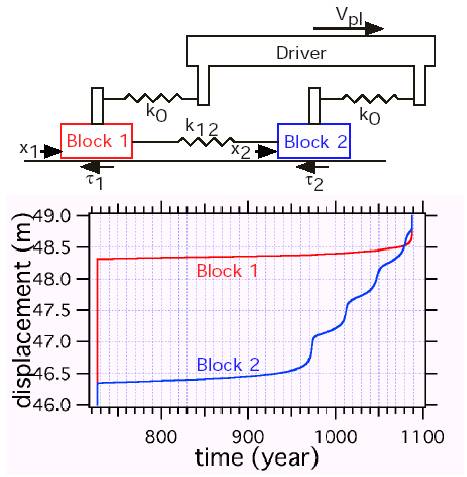
Fig. 7. Simulation with a two-degree-of-freedom
block-spring model. Episodic slow slip occurs
when the friction parameters of Block 2 are near the stability transition.
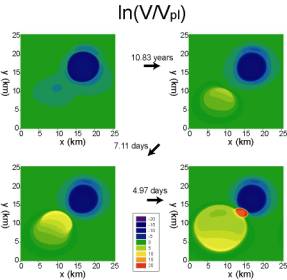
Fig. 8. Snapshots of simulated sliding velocity
normalized by the plate velocity.