4-7. Development of new
observation technology
●Highly-sensitive instruments based on optical
techniques.
Geophysical instruments
require long-term stability as well as precision because they should be
sensitive to small deformation of the ground which changes slowly over several
years. Laser wavelength can be
stabilized up to ~10-13, and laser interferometry has both precision and
long-term stability. We are developing
highly-sensitive instruments based on laser interferometry in order to apply
these techniques into deep- or ocean-borehole observations.
Figure 1 shows a main
part of an optical-fiber-linked tiltmeter; laser interferometers in a
rectangular mass, which is suspended as a reference, sense its motion with high
sensitivity. The tiltmeter is
housed in a pressure-proof chamber with an outer diameter of 236mm, and is
installed at the bottom of an observation borehole. Since only the laser light through optical fibers is used to
communicate between inside and outside the borehole, any electric heating or
noise in the tiltmeter is removed.
Besides, output of the tiltmeter can be calibrated after installation
with reference to the laser wavelength of its own; this is one of the
significant advantages in actual observations.
In 1997, the
optical-fiber-linked tiltmeter was installed into an 80-m-deep borehole at
Nokogiriyama Geophysical Observatory of ERI, and has been working since
then. Both earth tides and
teleseismic waves have successfully been observed, showing high precision and
wide bandwidth. Figure 2 shows a
data comparison with a 42-m-long water-tube tiltmeter located in the tunnel of
the observatory. Almost the same
waveforms between two different tiltmeters indicate that the data are real
ground tilt and are free from instrumental noise. Small ripples, with a period of about 30 minutes and an
amplitude of ~10-8 rad, are considered to be 'seiche' (resonance of the sea)
occurring in the Uraga Channel near to the observatory.
Hence, we have shown the
availability of a borehole instrument with as good performance as conventional
one. The optical sensing is
advantageous to other methods especially in long-term stability and in-situ
calibration as well as precision.
Moreover, it is also promising for use in a high-temperature environment
in km-deep boreholes. From these
viewpoints, we have been investigating on application of optical techniques to
other instruments such as seismometers and strainmeters.
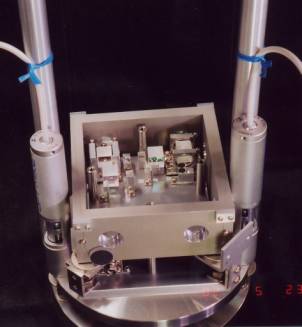
Fig.1. Main part of an
optical-fiber-linked tiltmeter.
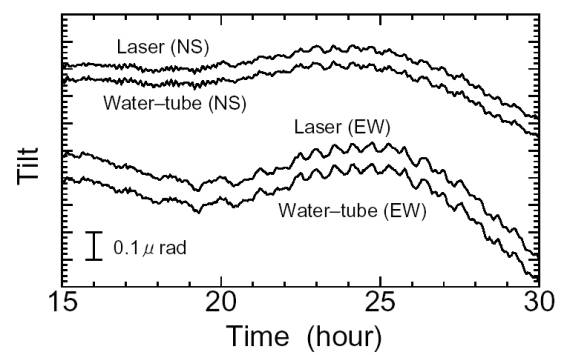
Fig.2. Data comparison with a water-tube tiltmeter.
●Precise and continuous
monitoring system of elastic wave velocity and attenuation by using pulse
transmission method
It is
often difficult to get high reliability in the observation of small change for
long period, e.g., 0.01 μstrain even for a month, by using extensometers,
tilt meters and borehole strain meters, although it is easy to get high
resolution of the order of 0.001 μstrain. Environmental
disturbances and possible time-dependent deformation within the stress
concentrated region could be responsible for such a low reliability. Both
DC-offest and gain drifts of the amplification system are also responsible. A
measurement of the sound velocity is one of the candidates to overcome such a
problem, because the reliability of the temporal change in the sound velocity
is fundamentally determined by the base clock of the system and the clock is
one of the most stable transducers. A timing error in the triggering the
waveform recorder can easily be reduced by an averaging method. A phase drift
can also be reduced by employing an amplification system with wide frequency
range.
Precise and continuous measurements of in situ sound velocity and
attenuation have been carried out for the past 8 years, 4 years and 2 years in
the vaults at Kamaishi (Iwate, northeastern Japan), Aburatsubo (Kanagawa,
central Japan) and Mizunami (Gifu, central Japan), respectively. The overburden
depth at Kamaishi is 450 m, and those of Aburatsubo and Mizunami are 10 m and
50 m, respectively. In order to get high stability and resolution,
piezoelectric transducers are used as ultrasonic wave sources. A transmitter
used at Aburatsubo is shown in Fig. 3. Unfortunately, details can not be found
in the figure, because the transmitter is completely covered with teflon sheet
for electrical insulation. The transmitter is made of laminated piezo-electric
transducers, being similar to the elements in the ultra-sonic cutter and
washing machine. At Aburatsbo and Mizunami, because of low Q and Vp, the
amplitude of the received signal propagated along 20 m distance has the order
of several tens micro-G, even though more than 1000 V pulse is applied to the
transmitters. In contrast, at Kamaishi, because of high Q and Vp, the amplitude
is several hundreds micro-G. Fig. 4 is a
photograph showing the measurement system at Mizunami. A 10 MHz
base-clock, a function generator and a digital waveform recorder are set on a
2000 V & 50 A pulse generator (duty factor is limited). The resolution of
the temporal change in the sound velocity is about 1 ppm at Kamaishi, 10 ppm at
Mizunami and 100 ppm at Aburatsubo. In the literatures, temporal variation of
100 ppm was the best of almost all the works in the similar system. At Kamaishi
test site, a clear dependence of the sound velocity on the barometric pressure
was found as shown in Fig. 5, where an effect of a tropical storm is seen in
the right hand side. The stress sensitivity of the sound velocity at Kamaishi
can be estimated as 1.4 ppm/hPa, based on the effect of barometric pressure,
which agrees well with the laboratory results (0.8 ppm/hPa). At Kamaishi, an
increasing trend of the sound velocity has been observed for the past 8 years.
The estimated increasing rate of the compressive stress is about 600 hPa/yr,
corresponding to the strain rate of 0.7 μstrain/yr. This estimation is
several times higher than the strain rate of the northeastern Japan estimated
by GPS measurements.
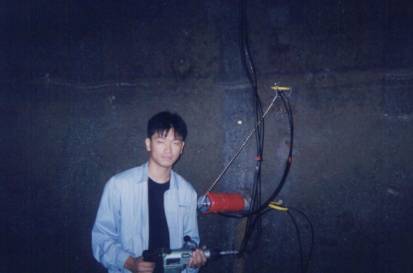
Fig.3. A
photograph showing the transmitter used at Aburatsubo test site. The
transmitter is made of laminated piezo-electric transducers. In response to the
applied electric pulse, the piezo-electric transducers vibrate to make a sound
in rocks. The transmitter for Kamaishi test site is by far smaller than that
for Aburatsubo, because of the difference in the rock properties, particularly
Q and Vp.
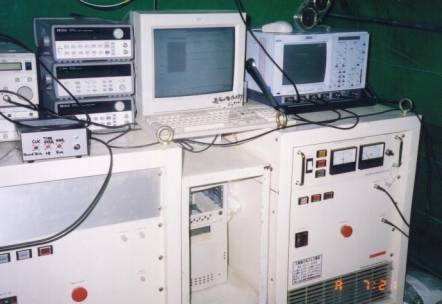
Fig.4. A measurement system used at
Mizunami test site. The system for other sites are fundamentally the same. An
instrument shown in the lower side of the figure is the 2000 V & 50 A pulse
generator (a duty factor is limitted). A 10 MHz base-clock, a function
generator and a digital waveform recorder are set on the big pulse-generator.
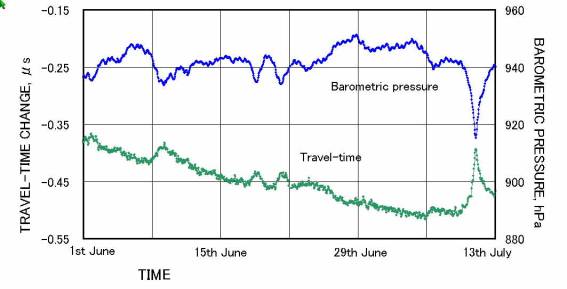
Fig.5. Temporal change in the
travel-time and barometric pressure obtained at Kamaishi test site for a period
from June 1 to July 13, 2002. The travel-time is plotted as a difference from
the reference wave (Feb. 2002). No altitude correction to the barometric
pressure was carried out. As the travel-time of the first break is about 2.8
ms, the full range of the ordinate for the travel-time corresponds to the
variation of about 140 ppm. A sudden change and recovery shown in the
right-hand side of the figure is an effect of a tropical storm.
●Development of a low-power consumption VSAT system
ERI began to use a
communications satellite for the earthquake telemeter system in 1989 when the
private sector satellite-based communications service started in Japan. In
1996, the satellite seismic telemetry system of a nation-wide scale was
introduced. The system enabled to collect earthquake observation data using
VSAT (very small aperture terminal), and also to distribute them to
researchers. Since the VSAT in this system consumed the electric power of more
than 300 W, although the surface communication circuit became unnecessary by
satellite communication, observation sites was still restricted to the place
where a commercial power supply was available.
Since 2001, a new VSAT
system which consumes only 1/10 of the power and occupies only 1/3 of the
frequency bandwidth has been introduced and under test. The new system realized
a truly independent seismic telemetry station. As of 2003, ERI has two hub
stations and 55 VSATs of the new system (Fig.6).
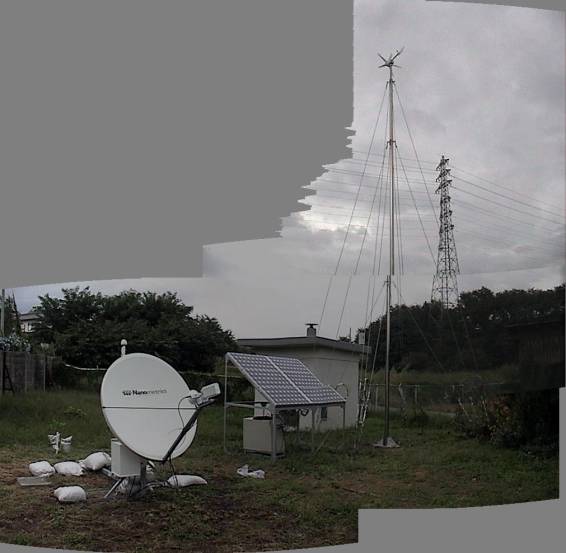
Fig.6. New VSAT seismic
telemetry equipments fed by combined solar and wind power systems under test.
● Ocean
bottom seismometers for long-term and broadband observations
The Earthquake
Observation Center and the Ocean Hemisphere Research Center have developed the new
ocean bottom seismometer for the broadband seismic observation on the seafloor
(BB-OBS). In addition to the BB-OBS, the Earthquake Observation Center has
developed the new ocean bottom seismometer for the long-term observation over
one year (LT-OBS). The designing concepts of the two OBSs are almost the same
as our conventional high-sensitivity OBS that is compact and reliable. We have
three types of pressure housings for the instruments; that are the 43-cm glass
sphere, the 50-cm titanium sphere and the 65-cm titanium sphere. We have four
types of seismic sensors. The natural period of each sensor is 0.2 s, 1 s, 30 s
and 360 s. A continuous recording over one year is practical with the use of the
HDDR-type digital recorder with the recording capacity over 40 GB (Fig.7).
Another new OBS is under development for the seismic observations at the
ultra-deep seafloor that is deeper than 9,000m. The observations using these
OBSs advance the study of asperity in the vicinity of the plate boundary and
the tomographic study of deep structure under the ocean.
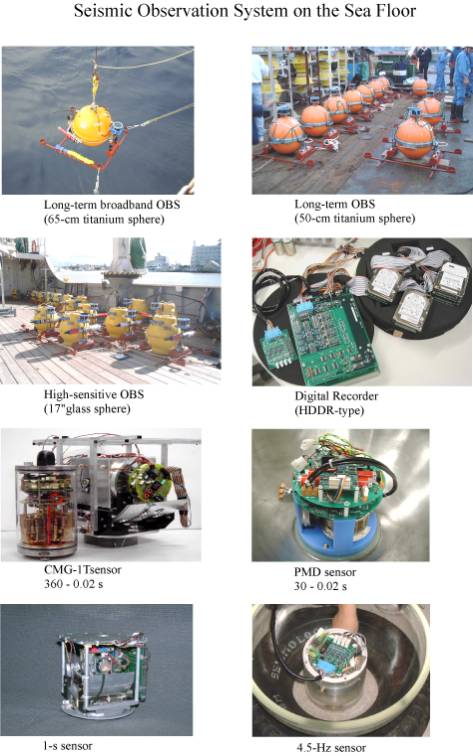
Fig.7. Ocean bottom seismometers developed by the Earthquake Research
Institute. These OBS systems enable us to do a long-term seismic observation
over one year and a broadband seismic observation on the seafloor.