5-14. Source Rupture Process and Strong
Motion Generation
Asperities and barriers are responsible for the complexity
of rupture propagation and thus control the earthquake size, the sequence and
the strong motion generation. We have so far carried out inversion of both seismic
data and GPS data to examine the asperities of large earthquakes.
(A) Asperity distribution derived from
waveform analysis
The analysis of recurrent earthquakes off Sanriku, Japan, region shows that
the asperities and the aseismic areas are partitioned in space. In fact, the
1968 Tokachi-oki event mainly consists of two asperities, one of which is
coincident with the asperity of the 1994 Sansiku-oki event.
(B) Partition between asperity and
slow-slip area
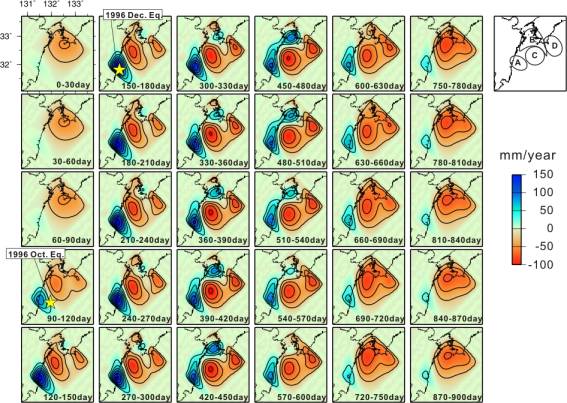
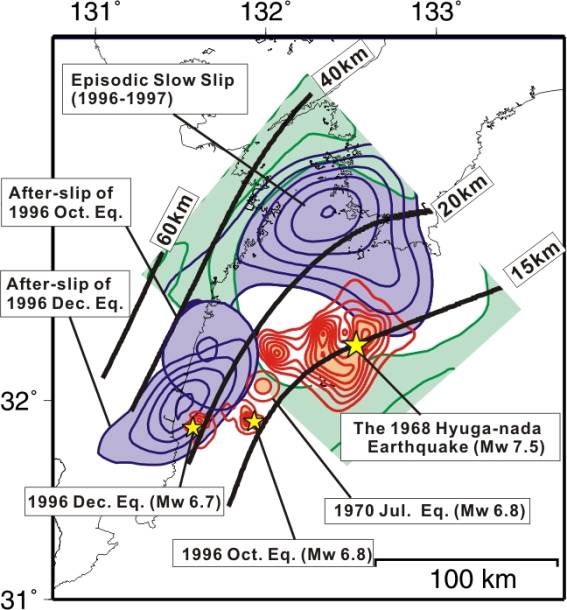
GPS data provided by GISNET was inverted into fault-slips in Hyuga-nada
region. Figure 1a shows the snap shot for every 30 days. We found that, after
two large earthquakes in 1996, a slow fault-slip expanded from the source area
to the north and then triggered another slow event with a characteristic source
duration of about one year. The aseismic slip has increasingly highlighted a
particular site where little slow fault-slip takes place. It is noteworthy that
the highlighted area is just the site of a past large earthquake: the 1968 Hyuganada
earthquake of M7.5 (Figure 1b).
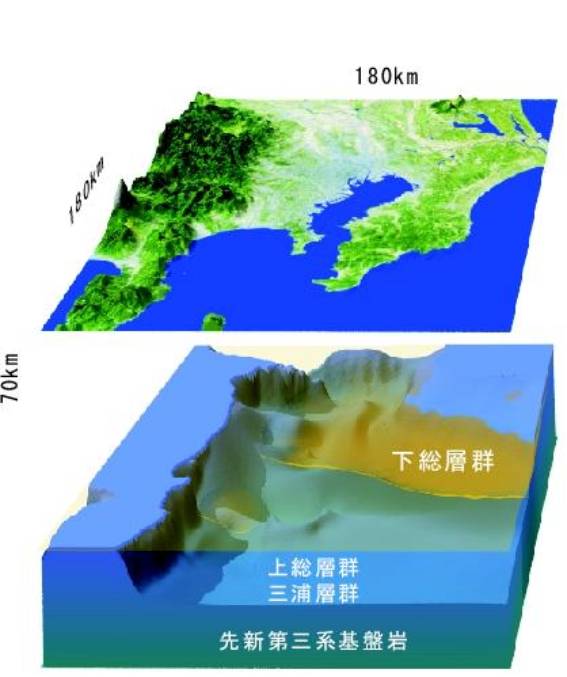
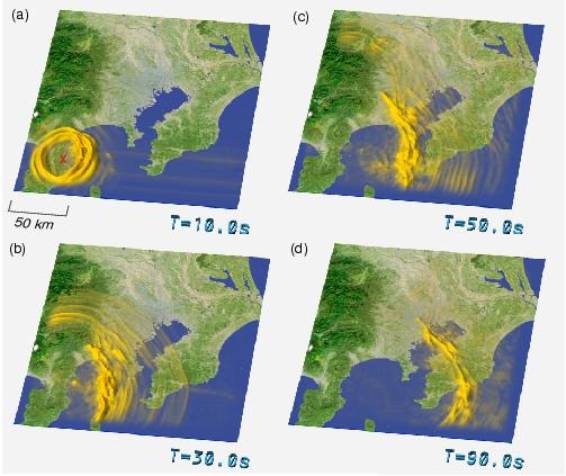
(C) Strong motion simulation
An efficient approach of the pseudo-spectral method was developed for a
computer simulation of wave-field in 3D structure. As an example, the wave
field generated by the Izu-Toho-Oki earthquake of May 3 is shown in Figure 2. Figure
2a shows the 3D structure up to a depth of 70 km. Figure 2b shows a snap shot
of wave field obtained by the simulation. The result well reconstructs the characteristic
feature of the wave-field in Kanto area indicating a long ground oscillation.