The 2018 Krakatau eruption and tsunamis, Indonesia


updated on 15 January 2019


Introduction

 On 22 December 2018 (~21:00 local time, ~14:00 UTC), large tsunamis were generated at Sunda Straits, Indonesia, and they caused a great disaster along the coasts of the western Java and the eastern Sumatra. According to PVMBG*1, the Anak Krakatau Volcano that has continued the eruptive activity in recent years was partially collapsed, and tsunamis might be triggered by this event. After the collapse, Anak Krakatau still continues the eruptive activity, thus the current situation is carefully monitored by Indonesian authorities. The volume of collapsed material, the sequence of the event, tsunami generation and propagation processes, and their relationship to the eruptive activity are still unclear, although they are important to understand nature, dynamics, and hazards of volcanic edifice collapses. Also, unveiling this event will contribute to understand similar examples in Japan. Here, we report our preliminary results of numerical simulation of tsunamis and volcanic edifice collapse of Anak Krakatau.
Anak Krakatau is the small volcanic island that grew after the disastrous caldera-forming eruption in 1883 at this area (Figs. 1, 2).Before the collapse on 22 December 2018, the size of the island was ~2.1 km EW and ~2.3 km NS. The volcano consists of lava flows and a central cone, with an altitude >300 m above sea level (Fig. 3). The SW slope of the edifice was very steep, extending to the caldera floor ~270 m below sea level. The collapse occurred at southwest of the edifice and approximately a half of the island, including the summit area, was lost.


Fig.1. Location of Krakatau and Sunda Straits (modified from Fig. 1 of Maeno and Imamura, 2011)

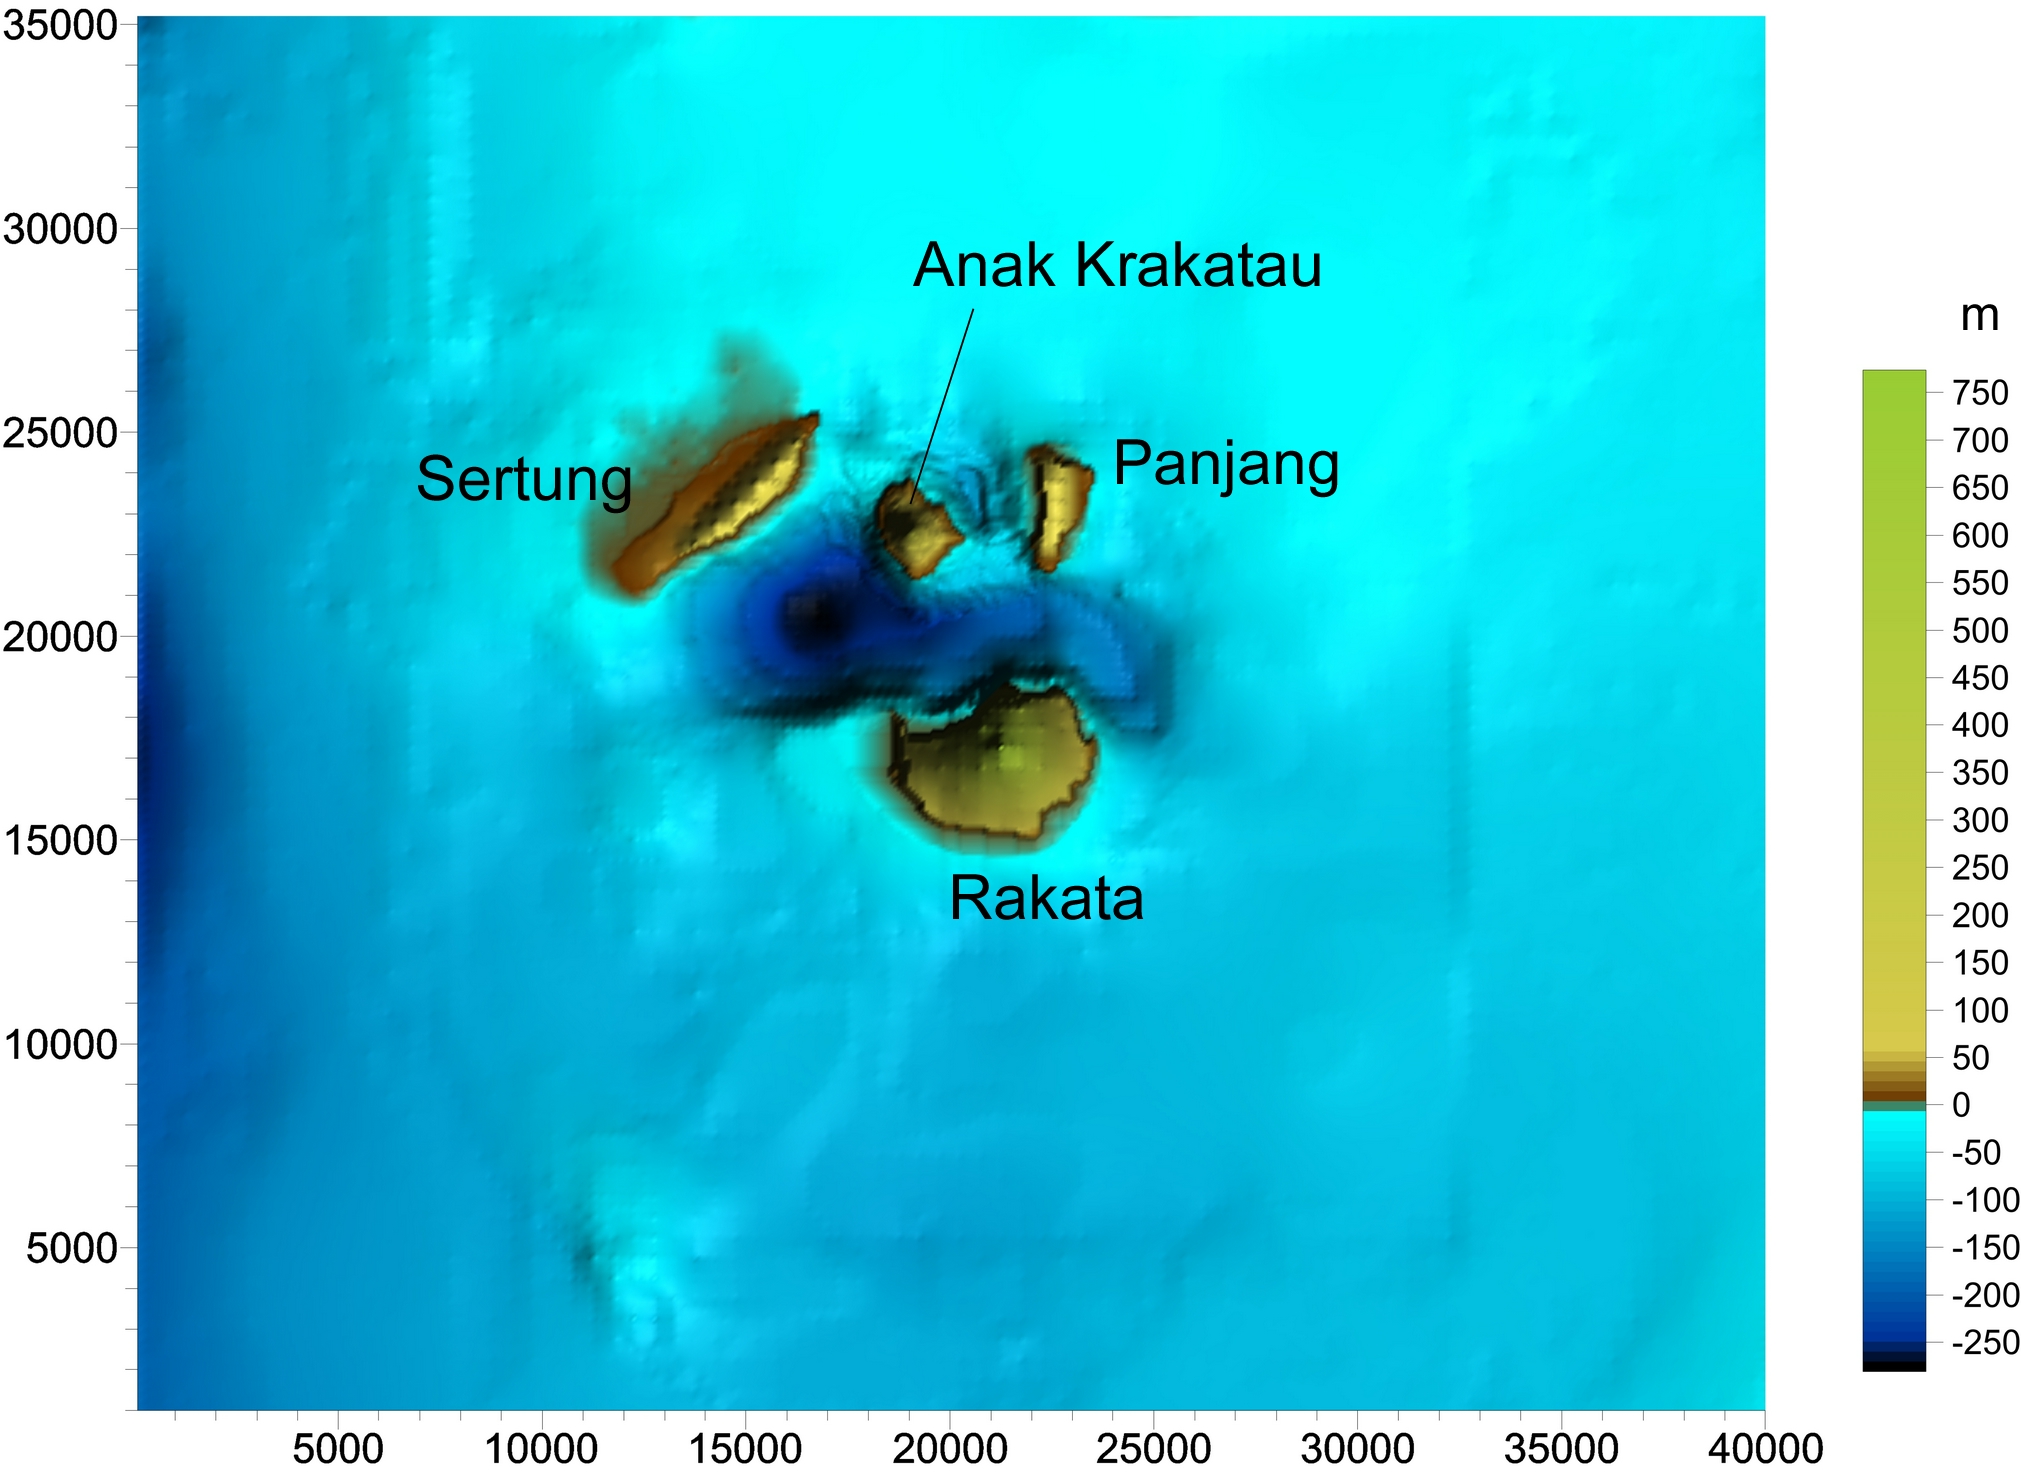
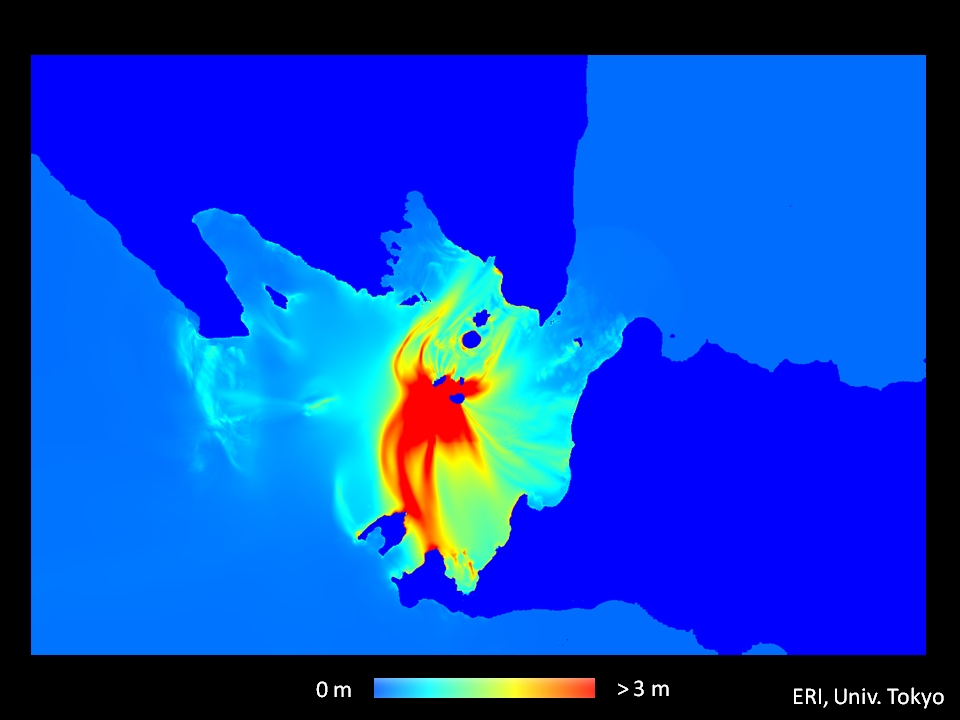
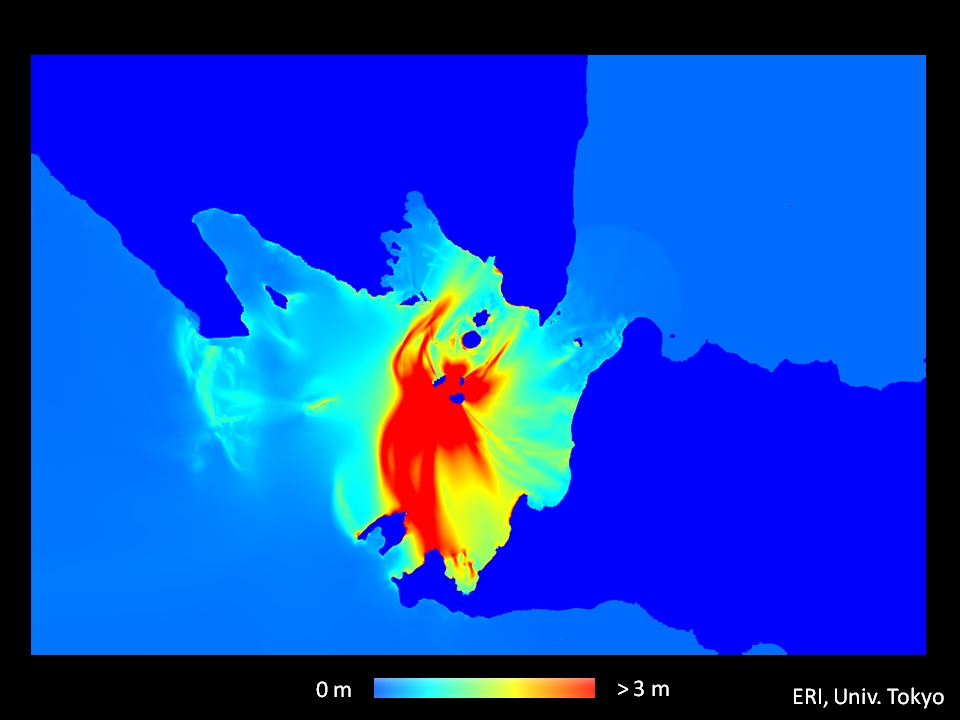
Fig.2. Topography and bathymetry of Krakatau volcano before collapse of Anak Krakatau. The central island is Anak Krakatau.

Fig. 3. Anak Krakatau before collapse. The size is ~2.1 km EW and ~2.3 km NS. The altitude of the central cone is more than 300 m below sea level. (Left) A view from the east. Sertung island is also seen backside. (Right) A view from the northwest. Photos were taken in September 2014.


Numerical simulation

 Numerical simulation was carried out using a two-layer shallow water model that has been developed to investigate tsunamis generated by gravity currents (pyroclastic flows, landslides, etc.). The model is based on a non-linear long wave theory. It is solved using a finite difference method*2, 3. Bathymetry data is the same as that in Maeno and Imamura (2011). It was prepared based on ETOPO1 and digitizing printed maps in documents*4. These data were then combined and interpolated with data from more proximal areas. Using these data, the maps were made by sampling an 83.33 m (= 250/3 m) grid for the proximal area and a 250 m grid for the distal area. In numerical simulations, a continuation-of-regions procedure was used to combine the two zones. The following three cases with different collapsed volumes were examined (Table 1).


Table 1 Initial condition of collapse
Volume (km3)
Case 10.16
Case 20.21
Case 30.26

The bottom friction coefficient of the gravity current was set to be 0.1 for both subaerial and submarine conditions. The interfacial drag coefficients between the gravity current and seawater were set to be 0.2.


[Examples of results of numerical simulation]

# Case 2 (Link to movie)

# Case 3 (Link to movie)


[Distribution of maximum wave height]


Case 1.
Case 2.
Case 3.
Fig. 4. Distribution of maximum wave height of tsunamis. For all cases, the maximum wave height reaches >20 m in proximal area, and it drastically decreases with distance. In the south of W coast of Java, the maximum wave height is relatively large. In some areas, the wave height becomes more than 3 m. Near Kalianda, Sumatra, north of Krakatau, the wave height also becomes large.


[Distribution of tsunami arrival time]

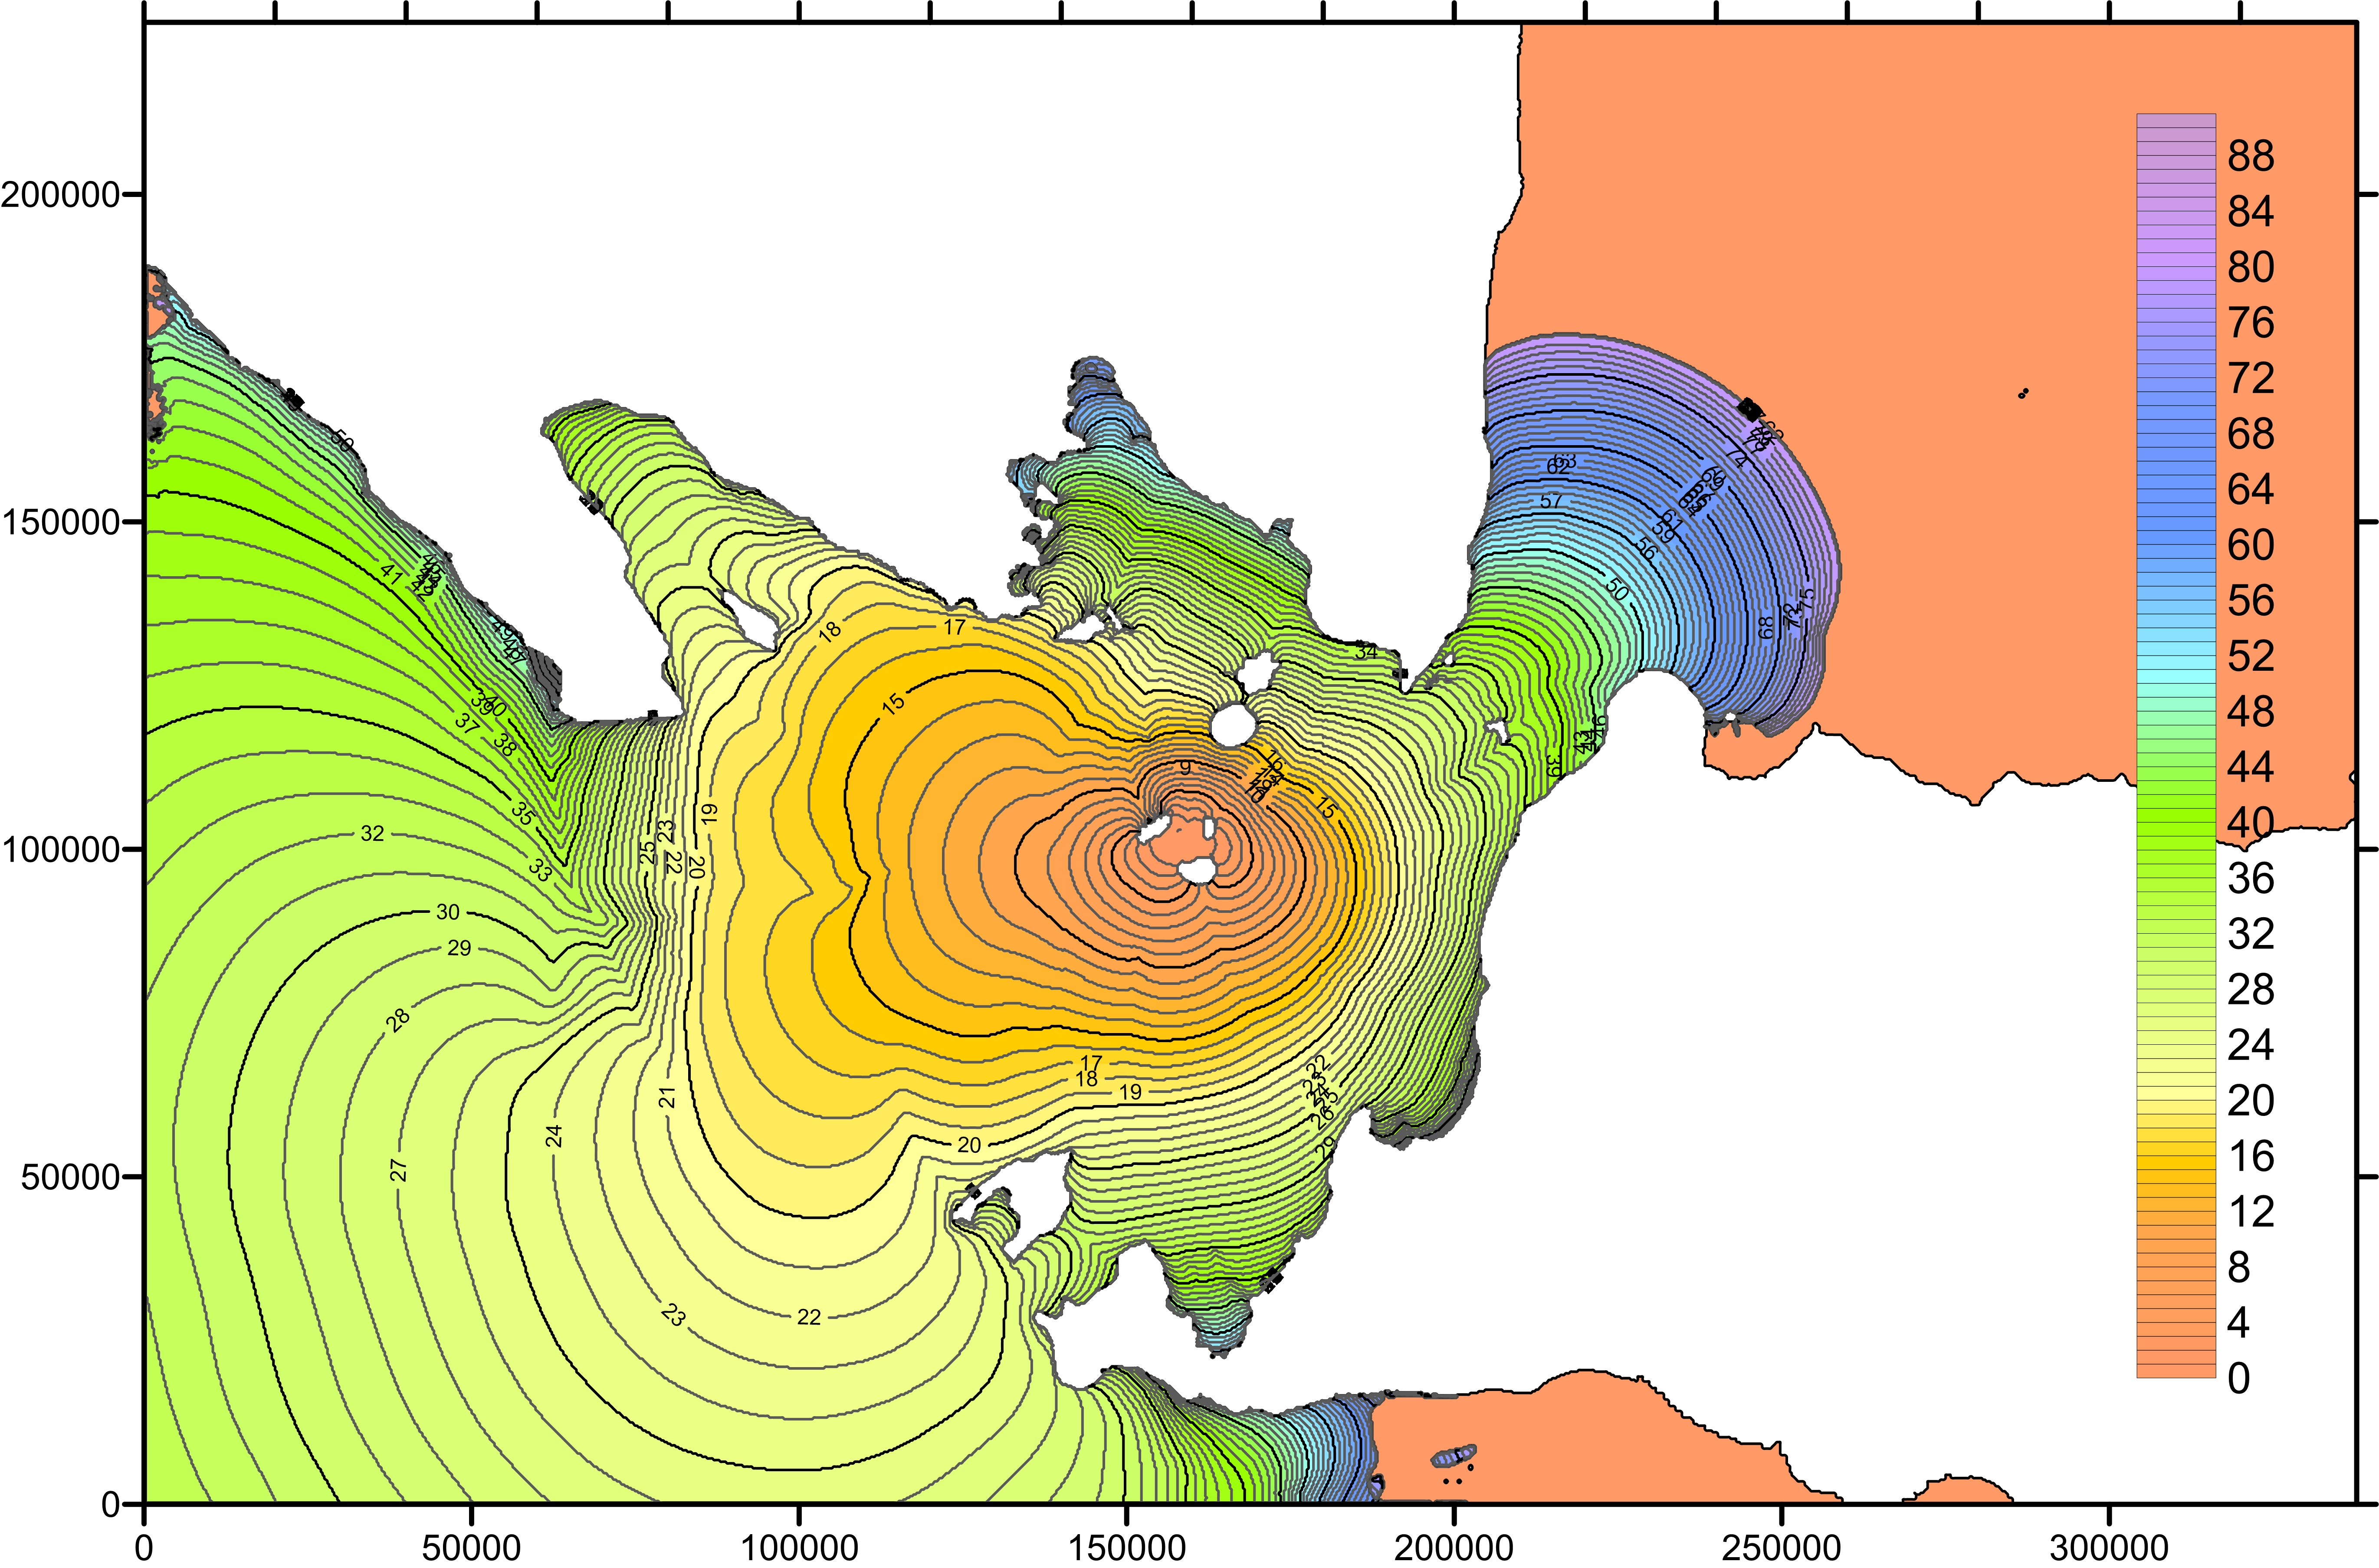
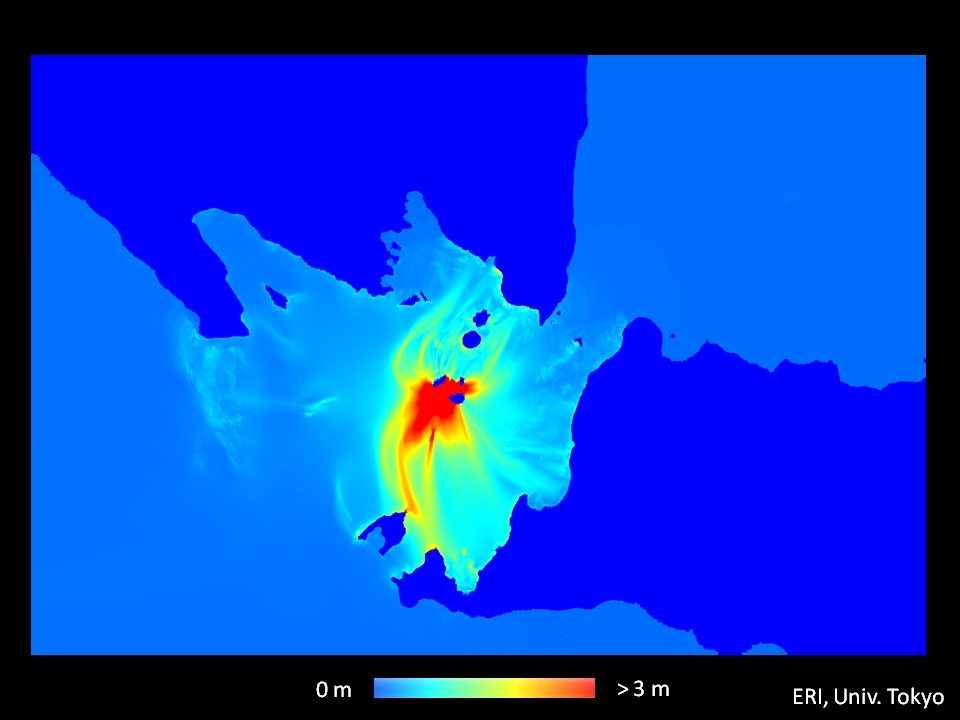
Fig. 5. Distribution of tsunami arrival time. Unit is min. Tsunami arrives at Carita, where significant disaster was observed, in 38 min.


[Characteristics of tsunamis at the western coast of Java]
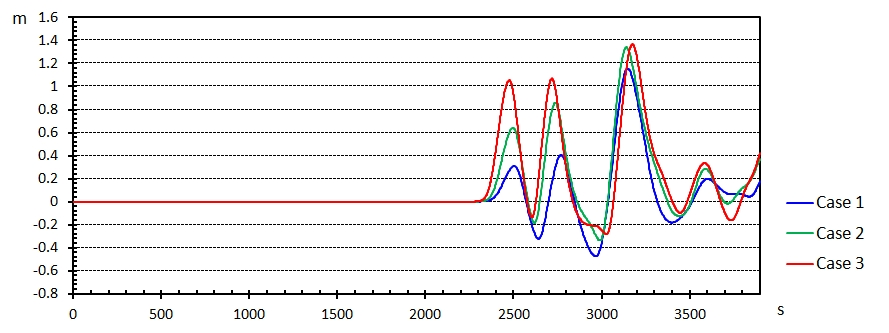
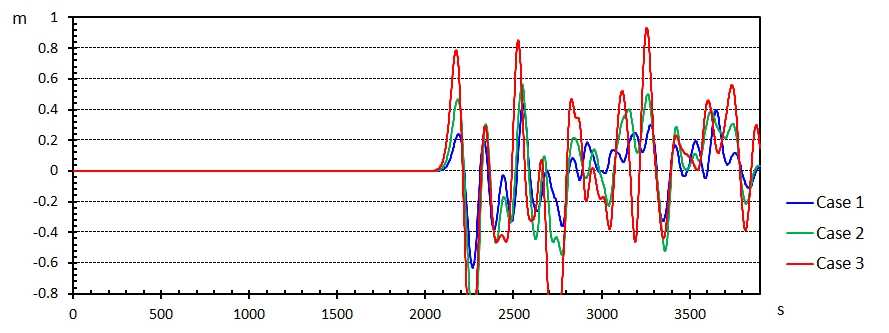
Fig. 6a Waveform output at Carita, west coast of Java. The first positive peak arrives at ~40 min. The waves with a maximum height >1 m arrive several times.
Fig. 6b Waveform output at Anjer, west coast of Java. The first positive peak arrives at ~36 min. The waves less than 1 m arrive several times.
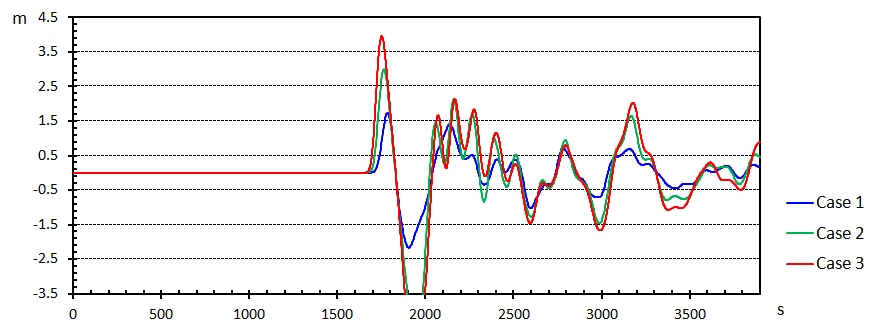
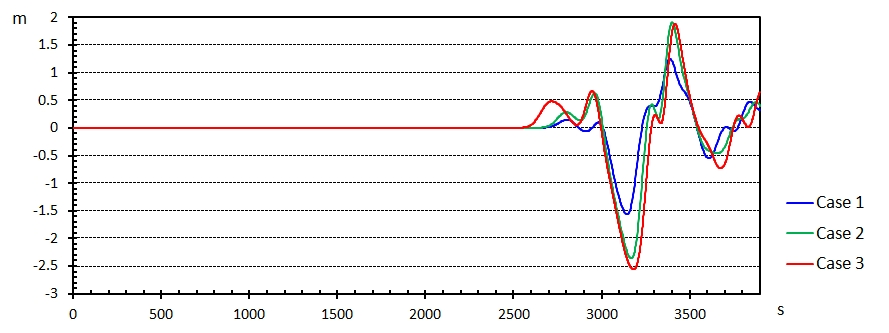
Fig. 6c Waveform output at Prinsen Eiland, west of Java. The first positive peak arrives at ~29 min. For Case 3, the wave height becomes more than 3.5 m. Fig. 6d Waveform output at Kalianda, east coast of Sumatra. The first positive peak is weak; however, for Cases 2 and 3, the wave height becomes more than 1.5 m.


Discussion and summary

 PVMBG reported arrival time and wave height of tsunamis observed by tide gage stations. According to their data, the first positive peak with 1.4 m arrived at 21:27 (local time) at Jambu station, Bulakan (12 km north of Carita). In order to generate the first positive peak with >1 m at this location, Case 3 or the case with more collapsed volume are likely. However, this result is not the same for other stations. For example, at Banten station in Ciwadan, 8 km NE from Anjur, the first positive peak with 0.27 m arrived at 21:40, indicating that this area may be explained by Case 1 or 2. In numerical simulations, for all cases, the maximum wave height in the southern area of the west coast of Java became higher than other areas (Fig. 4). This is probably becauase the direction of the collapse at the source was southwestward and the direction of tsunami propagation was gradually changed from SW to S-SE in the south of Krakatau by the effect of bathymetry.
 At this time, it is difficult to determine the collapsed volume precisely, but if tsunamis were generated only by a flank collapse, it may be reasonable to consider that the collapsed volume was at least ~0.2 km3 or more. Giachetti et al. (2012) also carried out numerical simulation of tsunamis generated by collapse of Anak Krakatau. They used the collapsed volume 0.28 km3, and estimated the wave height at Carita to be ~3 m.
 On the other hand, it is suggested that the tsunami generation event occurred at ~20:50-21:00 (local time) based on the tide gage records at Bulakan and other stations. However, in order to determine the timing and mechanism of the collapsed event more precisely, it is necessary to obtain more detail wave height data along the coast, as well as to evaluate the initial condition and model.
 Infrared images of Himawari-8 showed that a relatively large eruption plume occurred from Anak Krakatau at ~20:50. The relationship between the collapse event and the initiation of the eruption plume should be more investigated to constrain this eruption-tsunami event.


References
*1 Pusat Vulkanologi dan Mitigasi Bencana Geologi
*2 Maeno, F. and Imaumra, F. (2011) Tsunami generation by a rapid entrance of a pyroclastic flow into the sea during the 1883 Krakatau eruption, Indonesia. Journal of Geophysical Research, 116, B09205, doi:10.1029/2011JB008253.
*3 Kawamata, K., Takaoka, K., Ban, K., Imamura, F., Yamaki, S and Kobayashi, E. (2005) Model of tsunami generation by collapse of volcanic eruption: the 1741 Oshima-Oshima tsunami. In Tsunamis: cases studies and recent development (Satake, K., ed.), Springer, p79-96.
*4 Sigurdsson et al. (1991) Pyroclastic flows of the 1883 Krakatau eruption, Eos Trans, AGU, 72(36), 377-392.
*5 Giachetti et al. (2012) Tsunami hazard related to a flank collapse of Anak Krakatau Volcano, Sunda Strait, Indonesia. Geological Society, London, Special Publications, 361, 79-90.