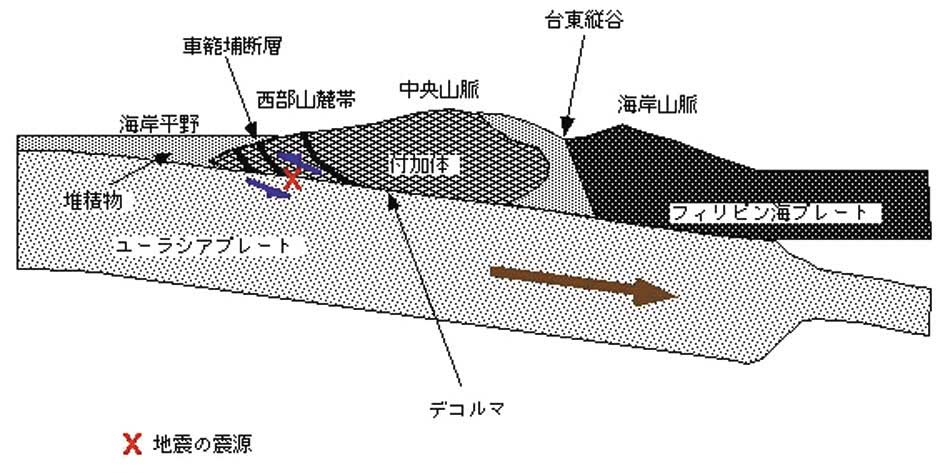
Taiwan is located in a collision zone between the Asian continent
and the Luzon Arc on the
Philippine Sea plate. The Tertiary sediments on the continental margin
have been off-scraped and
sliced by thrusts due to the collision, forming the uplifted mountain
range. One of the thrusts is the
Chelungpu fault on which the Chi-Chi earthquake occurred (Fig.2). Because
the collision is young, the
geological structure is close to that of the subduction zone.
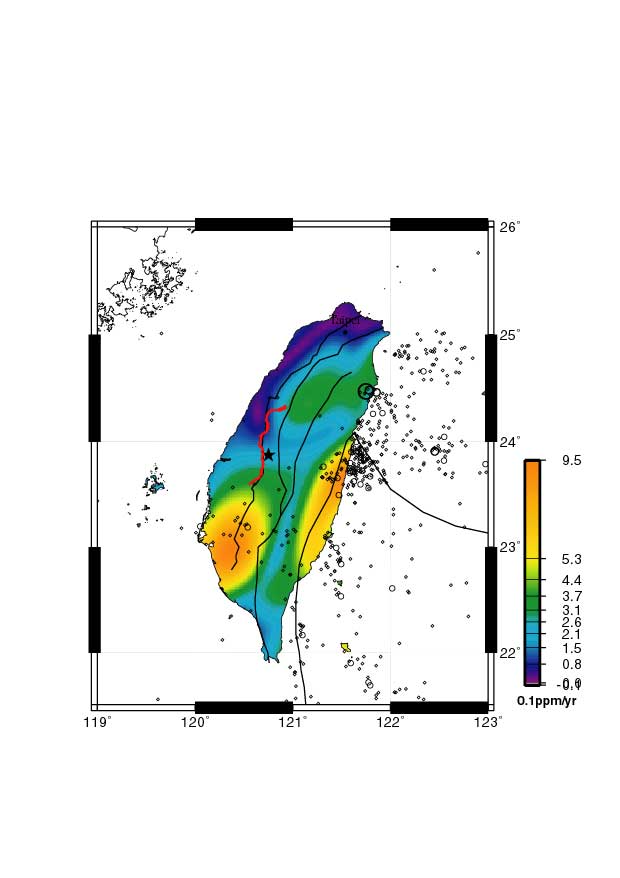
In order to help understand tectonic background of the 1999 Chichi,
Taiwan earthquake, ERI analyzed
data from the repeated GPS surveys conducted during a period of 1990-1995
in Taiwan. Figure 3
shows obtained pattern of maximum shear strain in the period. Shallow
earthquakes in the same period
are also shown. The figure indicates that the 1999 earthquake occurred
in the area of relatively low
strain rates between the eastern Coastal range and the southwestern
area of high strain rates.
Soon after the earthquake, ERI set up the special page on the web
site, and tried to provide
information about relevant researches and surveys on the Chi-Chi earthquake.
A preliminary result of
the source process was obtained on the following days from teleseismic
data, notifying that the major
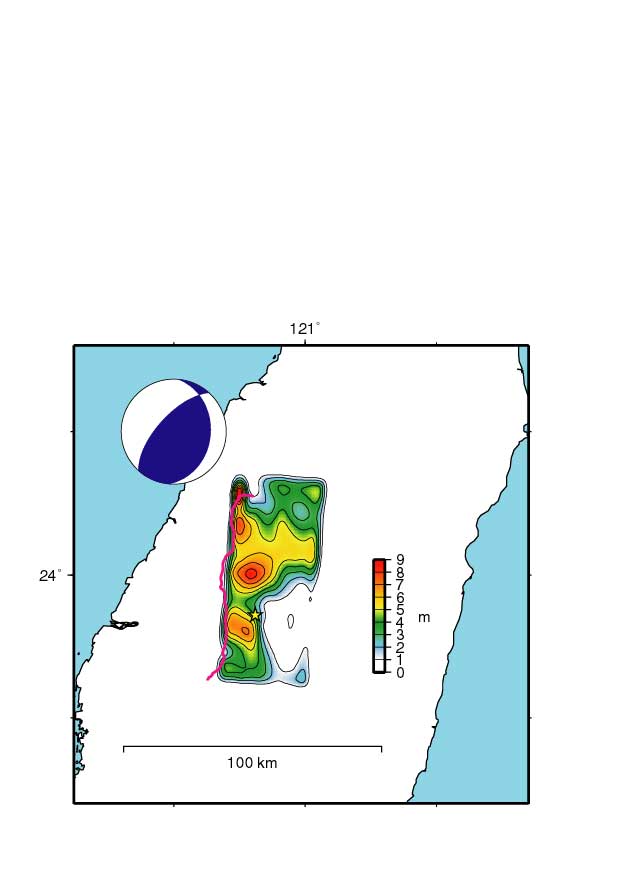
moment release occurred about 40 km north of the epicenter. Figure
4 shows a spatial distribution of
the fault slip obtained from the joint analysis of teleseismic data
and strong motion data. The maximum
slip amounts to about 9 m near the end of seismic fault.
In the strong motion data, we find very large long-period ground velocities
around the northern part
of the Chelungpu fault, but they did not cause very severe damage.
Damaging ground motions with large
velocities and accelerations happened in the epicentral area and the
east of it, which are 10 to 20 km
or more away from the fault. ERI investigated the damage to the buildings
close to observation stations,
and derived the relation between the actual damage and strong ground
motion by carrying out
earthquake response analyses with strong motion records as inputs.
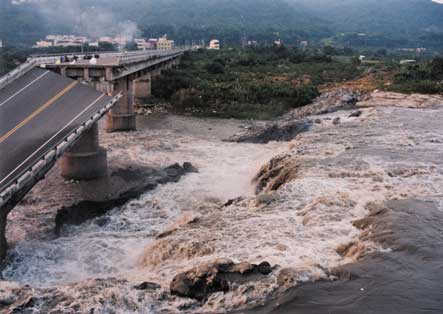
The surface ruptures with a large displacement, associated with the
Chi-Chi earthquake, appeared
along the Chelungpu fault, which is an out-of-sequence thrust in the
fold-and-thrust belt in the
western Taiwan. To determine the exact amount of net-slip and direction,
ERI carried out field survey
in October 1999. The maximum amount of net-slip obtained was 10.1 m
in the northern part of the
fault. The slip directions are concordant with those from GPS measurements.
The surface ruptures
occurred along the pre-existing active faults determined by tectonic
geomorphology, except for the
short segment in the northern part of the fault. The survey of tectonic
geomorphology across the
Chelungpu fault in 2000, revealed the vertical crustal movement last
100 ka, suggesting that the
amount of slip along the frontal thrust (Changhua fault) is as large
as one of the out-of-sequence
thrust (Chelungpu fault).
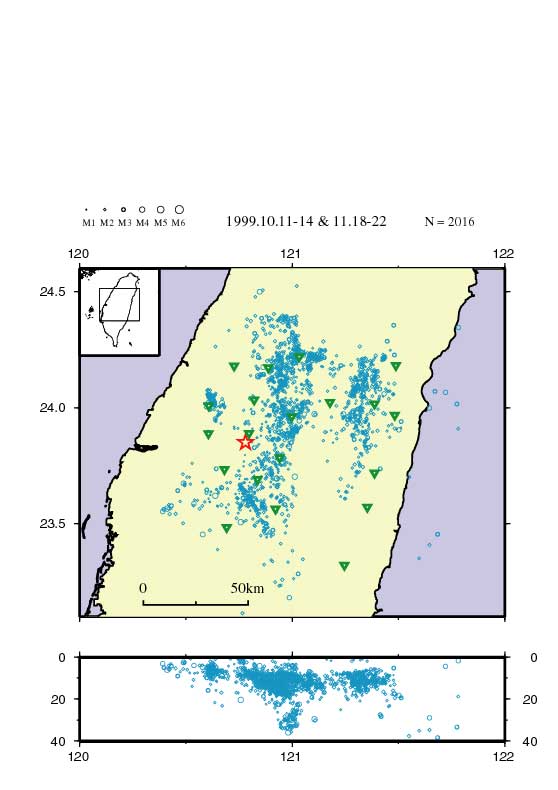
ERI have conducted an aftershock observation of the 1999 Chi-Chi,
Taiwan, Earthquake. We deployed
20 seismographs in and around the focal area. For two months observation
we recorded a large number
of aftershocks. Taking the lateral heterogeneity in the crustal structure
into account, we have a clear
distribution of aftershocks (Fig.5). There are three particular trends
in an east-west cross section: an
east dipping distribution, a very low angle distribution, and a deeper
distribution. They correspond to the
fault plane of the main shock, the supposed decollement between the
accretionary wedge and the
upper boundary of the Eurasian Plate, and activities in the Eurasian
plate.
A plausible range of the number of major aftershocks of the 1999 Chi-Chi,
Taiwan earthquake was
tried to predict. Based on the modified Omori formula, the number expected
in a certain time period
was estimated. Among 13 trials of prediction, 11 cases were successful
during 2 months after the main
shock. Such an attempt will contribute to the temporary planning of
disaster prevention and elimination
of over-anxiety among the people in the epicentral area.
In order to observe postseismic deformation, ERI deployed eight single
frequency and two dual
frequency GPS receivers about three weeks after the Chi-Chi Earthquake.
The single frequency
receiver is developed in ERI. Ten GPS receivers formed the linear array
perpendicular to the strike of
the earthquake fault. This GPS line array crosses the fault trace on
the surface from Taichung City to
central mountain area because the surface projection of the maximum
slip area on the fault is about
40 km east of Taichung City. We detected the movement to the west at
the sites on the hanging wall
in the eastern area, while no movement on the footwall in the western
area. The displacement rates
are 1 to 1.5 cm/month, suggesting heterogeneous postseismic deformation.