Top Next
7-3. 2000 Volcanic Activity of Miyake-jima
<<Organizations>>
・ Immediate Response of ERI
On the evening of June 26, 2000, Japan Meteorological Agency (JMA)
issued a caution of the
Miyake-jima volcanic activity. A few hours later, ERI organized the
steering office to support various
kinds of geological and geophysical observations. The office gathered
information on the eruptive
activity as well as earthquake swarm which was induced probably by
the migration of magma. Special
page was set up on the ERI web site, where research activity and relevant
information were provided in
and outside ERI. The office also arranged temporal meetings for data
examination and interpretation.
・ University Consortium for the Integrated Volcanological
Observation
Before the 2000 eruption of Miyake-Jima Volcano,
many volcanologists thought that the next
eruption would occur in the beginning of the next century. Therefore,
various investigation researches
have been done vigorously. After the beginning of the present volcanic
activity, volcanologists started
precise observations and contributed individually to JMA which has
a responsibility to watch the
volcanic activity by reporting the observations and advising on the
interpretations. However since the
activities of Miyake-Jima became high, University Consortium for the
Integrated Volcanological
Observation on the Miyake-jima has been organized. It consists of Head,
coordinator, and six
observation units (seismology, crustal movement, gravity, geothermal
and electromagnetic research,
volcanic gas, geology, and material science). ERI fulfilled a bureau
function of this observation group.
The purpose of this group is to observe the whole volcanic activities
and to construct and verify a
physical model of the Miyake-Jima eruption to predict the future activity.
The bureau of the
observation group decides the policy of the research and a budget requirement,
and makes the
adjustment of the observation with the JMA. The activity of this group
is leading the research for the
similar volcanic activity in Japan and in the world, and widely supports
the JMA by the advanced
observations and interpretation of the data. The activity of the observation
group and the aim of the
research are presented on the homepage. These pages get high evaluation
not only from the
community but also from Miyake-Jima islander and the citizen.
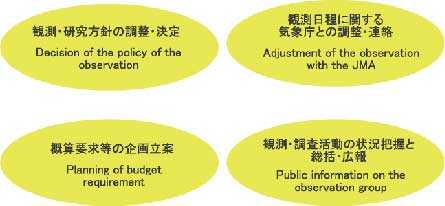
Fig.1. Bureau function of the University Consortium for the Integrated
Volcanological
Observation
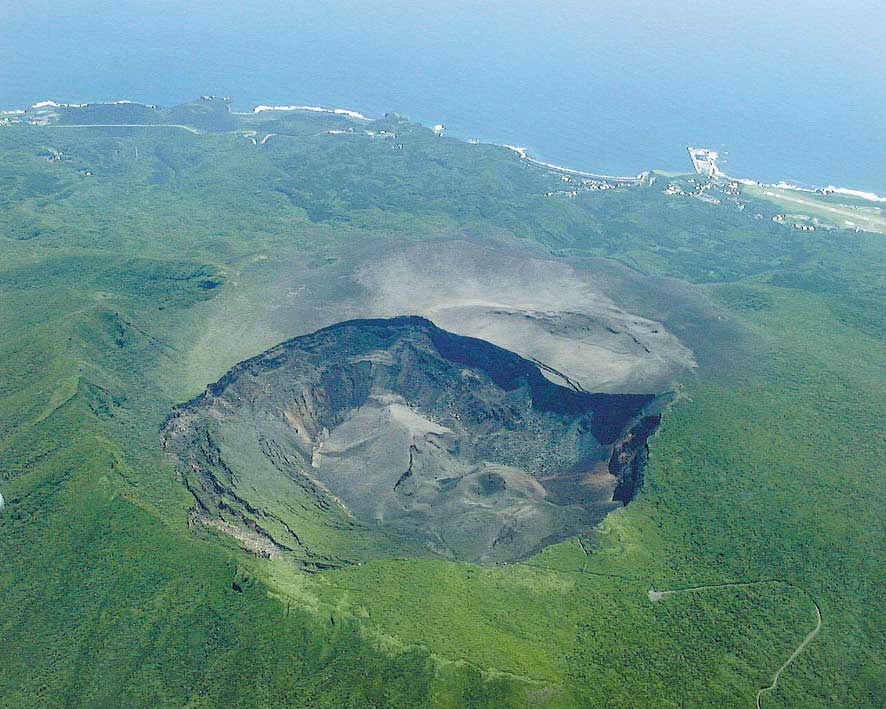
Fig.2. Collapsed crater at the summit of Miyake-jima volcano that
appeared on July 8,
2000. Taken from an aircraft of Japan
Coast Guard on the July 9 morning.
<< Research reports >>
・ Sequence of the Summit Collapse and Eruptions
The eruption started with a small submarine eruption on 27 June 2000.
A sudden collapse of the
summit area on July 8 developed into intermittent eruptions from the
summit (Fig. 2). Geologist group
inspected products of each event, studied their petrology, and kept
monitoring the eruptive activity
from the air. The lava of the submarine eruption is close to that of
the 1983 eruption. The dimension
of the summit collapsed crater increased until mid-August; its final
dimension is about 1.6 km across,
0.5 km deep and 0.5 km3. The total volume of eruptives is 0.01 km3,
much smaller than the former.
These strongly indicate the formation of large open space under the
volcano prior to and during the
eruptions. The products are fine volcanic ash, and unlikely contain
essentials of this eruption, but have
compositions showing strong contribution of hydrothermal fluid. The
largest eruption whose ash cloud
rose about 15 km above the summit took place on August 18. Volcanic
ash of it fell over the whole
Miyake-jima and stones were showered on the residential area. Ash clouds
moved slowly such as
pyroclastic flows, and enveloped houses in the northern coast on August
29 (Fig. 3). Though the
eruptive activity itself had declined in September, strong degassing
had continued since then.
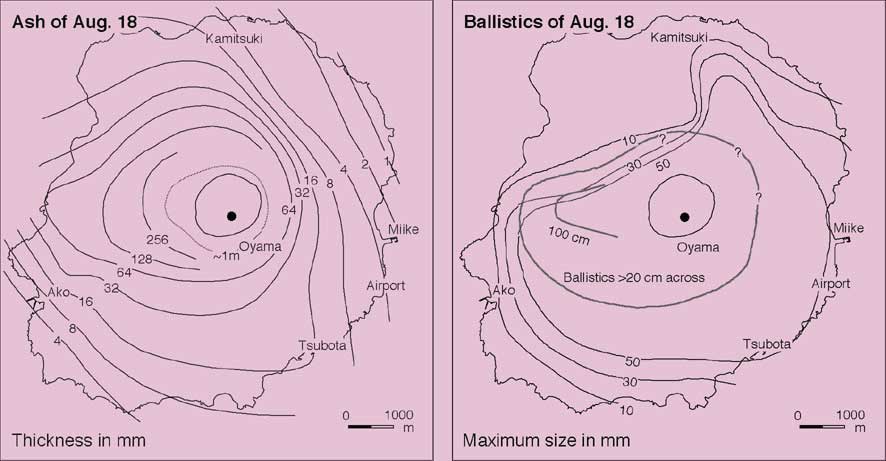
Fig. 3. Deposition of eruption products of the August 18 eruption.
Left: volcanic ash.
Right: ballistics and cinders.
・ Earthquake swarm started under the Miyake Island
Earthquake activity spread toward the northwestern oceanic region. It
includes five large earthquakes
with the magnitude larger than 6.0 and a huge number of earthquakes.
To get better resolution for the
spatial and temporal changes in the activity, we conducted a series
of pop-up and buoy telemetering
ocean bottom seismometer observations. The epicenter distribution obtained
strongly indicates a
northwest-southeastern lineament. The vertical cross-section shows
two trends; the deeper
(7-13km) distribution forms a very thin zone and the shallower (<
7km) distribution is much thicker
(Figs. 4, 5). This feature is important for understanding the behavior
of the magma migration.
Several strong motion seismometers were also installed at the Izu-islands
in the early stage of the
earthquake swarm. The tomography of Q−1 obtained from these data clearly
indicates high attenuation
area in the straight between Miyake-jima and Kouzu-shima (orange area
in Fig. 6).
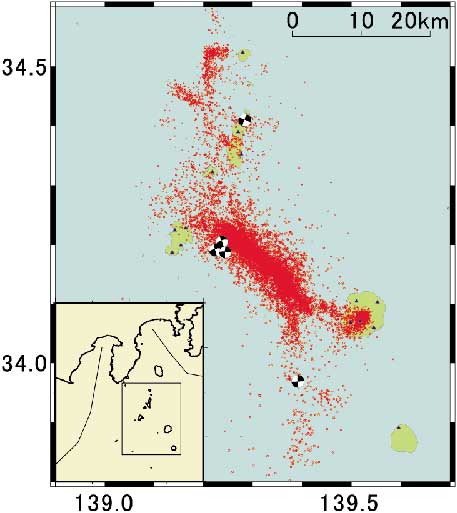
Fig. 4a. Epicenter distribution (Jun. 26 - Dec. 31) and focal mechanisms.
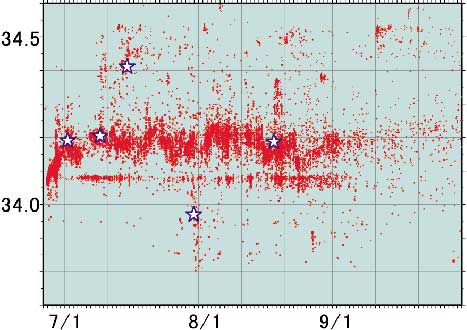
Fig. 4b. Time-space distribution (Jun. 26 - Sep. 30).
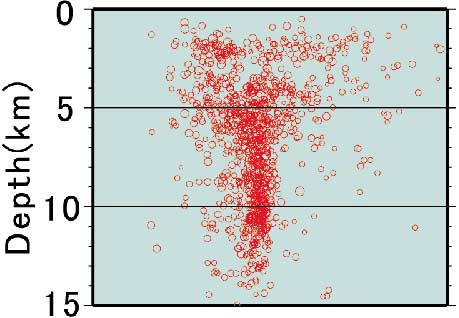
Fig.5. Cross-section rotated 50 degrees.
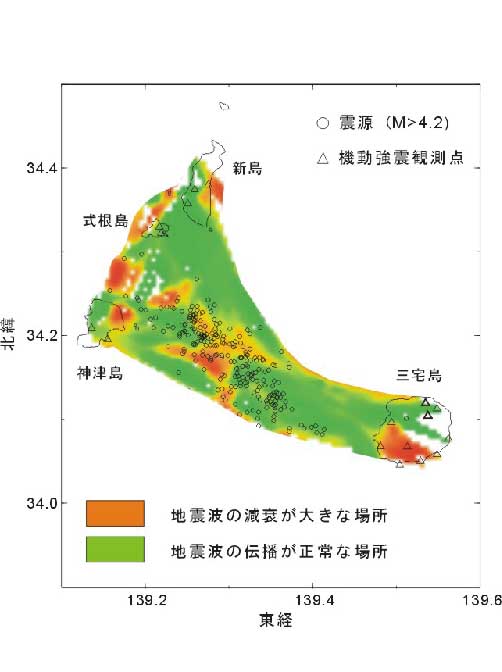
Fig.6. Tomography image obtained from strong motion data.
・ Source Process of the long-period seismic pulses
Very-long-period seismic pulses (VLP pulses) were observed a few times
a day from July 8 to Aug 18,
2000, synchronized with the step-like tilt increase (Fig. 7). The pulse
width is 40 to 50 sec and is
almost constant regardless their amplitude. The occurrence of VLP pulses
completely ceased after the
summit eruption on Aug 18. Waveform analyses of these signals show
that the source mechanism of
these pulses is characterized by large volume expansion of 107 m3.
Several models have been
proposed. One is an intermittent subsidence of a piston in the volcanic
conduit (Fig. 8). Another is an
underground vapor expansion model (Fig. 9).
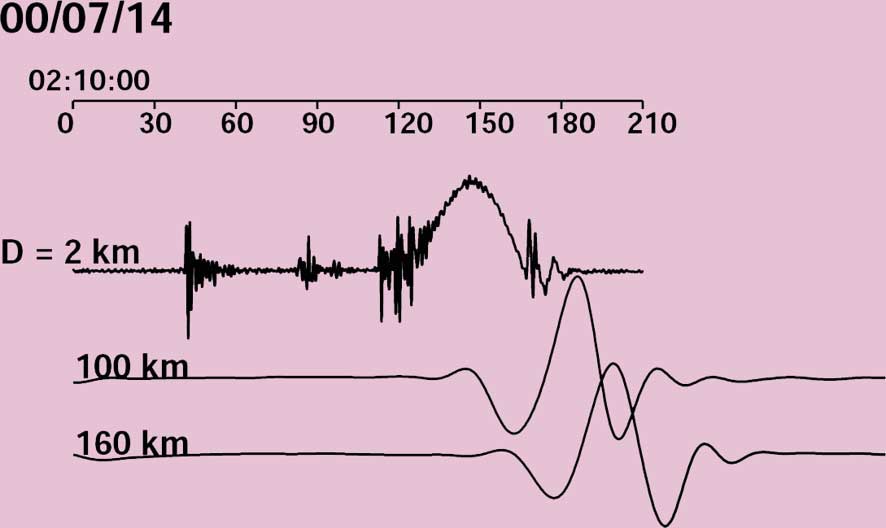
Fig.7. Example of 50s-seismic pulses (2:10 July 14th). KAS: broadband
seismometer in
the Miyake-jima, JIZ
and FUJ (NIED): broadband seismometer in Honshu.

Fig. 8. "Piston drop model". Step 1: Pressure in the
magma reservoir gradually decreases with steady
magma flow from the reservoir. Piston has not yet
started descending due to reservoir pressure and
friction. Step 2: As reservoir pressure decreases
down to some threshold, side friction is not enough
to stop the piston from sliding down. The piston
slammed into the magma causing reservoir pressure
increase which generates a very-long-period seismic
pulse.
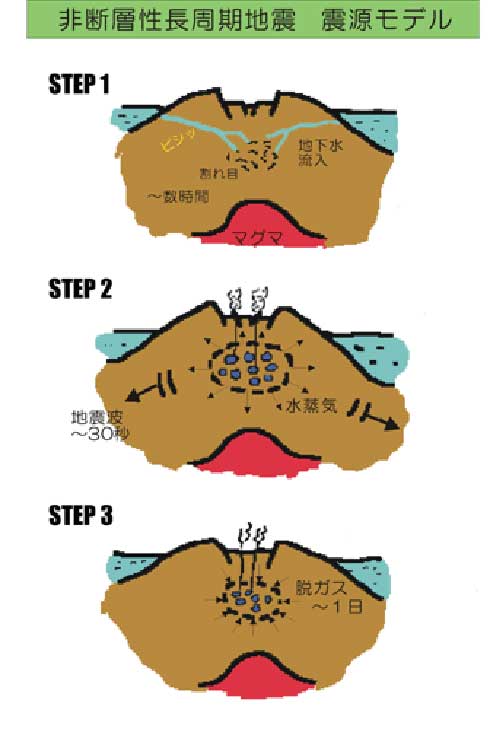
Fig.9. "Underground vapor expansion model". Step 1: The groundwater
gradually
permeates the cracks under the summit and approaches
high-temperature region.
Micro earthquakes are triggered at this stage. Step 2: The
groundwater is heated into
a state of overheating inflation, which causes very-long-period
pulse. Step 3: While
the expanded steam passes through the cracks, it is cooled
into water. Accordingly
Mt. Oyama is slowly contracted.
・ Magma Intrusion inferred from a dense GPS network
To observe crustal deformation in the Miyake Island, GPS observations have
been extensively carried
out since 1995. Total number of observation points is about 45. Three
permanent stations were
deployed and the data are collected through public telephone lines
every morning and store on a
hard-disk of a Unix machine. On June 26, 2000 we can detect the magma
intrusion in Ako region in the
Miyake Island accompanied with the earthquake swarm using GPS data
(Fig.10). The crustal deformation
accompanied with the summit collapse was observed in July (Fig.11).
To check how crustal deformation
occur automatic GPS analysis system was constructed. On this system
GPS RINEX data are gotten
from the Unix machine and then are analyzed by Bernese GPS Software
Ver.4.2 BPE. Then the result
of the analysis are upload on the Home page of our institute.
・ Spatio-temporal Gravity Variation associated
with Volcanic Activity
Since the onset of volcanic activity of the Miyake-jima volcano, Japan
in June 2000, we have been
carrying out frequent (once per 10 days) gravity measurements around
the volcano. Combined use of
an absolute gravimeter FG5 with two LaCoste-Romberg gravimeters enables
us to trace the accurate
and high-resolution spatio-temporal gravity variation caused by the
event. It exhibits a peculiar and
informative spatial pattern for each volcanic phase.
<Phase 1> (intrusion and pre-collapse): Dyke intrusion associated
with deflation of a deep magma
chamber clearly left gravity increase exceeding 100 microgals around
the supposed dyke. We also find
150 microgals decrease on the caldera floor that was destined to collapse
in two days after our
measurement (Fig.12a). The signal can be well modeled in terms of a
cavity created at 2 km beneath
the caldera.
<Phase 2> (implosion): The summit caldera steadily continued to collapse
in 2 months (from July 8) to
have a diameter of 1500 meter or more with depth of 450 meter in September
2000. The loss of mass
(exceeding 1.200 billion tons) caused systematic gravity decrease exceeding
1100 microgals (Fig. 12b).
<Phase 3/4> (explosion/degassing): The gravity measurement continued
to provide information on
volcanic activity since September 2000, when crustal deformation observations
suffered from problems
of power supply and telecommunication systems; the Miyake-jima island
was evacuated in early
September 2000.
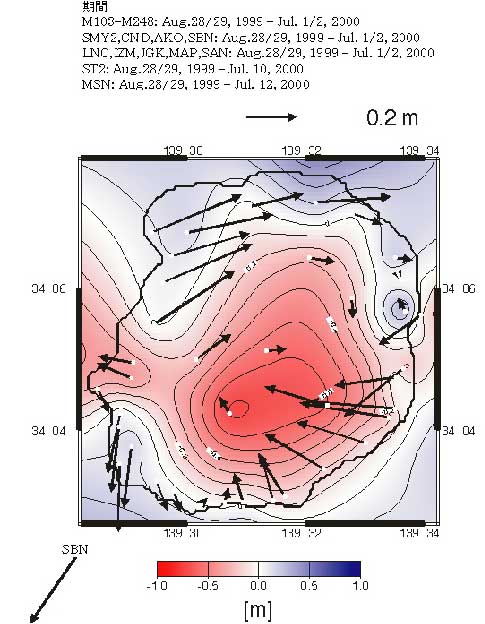
Fig.10. Crustal deformation detected by GPS observation on June 26,
2000. Arrows
show horizontal displacements. Vertical displacements are
indicated by contour lines
and color.
F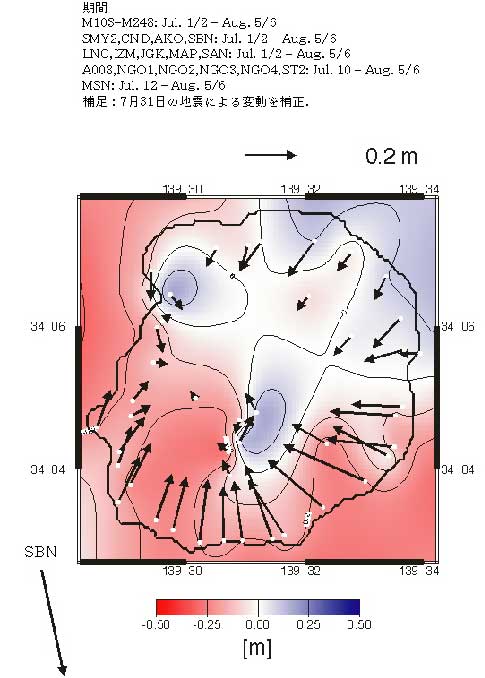
Fig.11. Crustal deformation detected by GPS observation in July,
2000. Arrows show
horizontal displacements. Vertical displacements are indicated
by contour lines and
color.
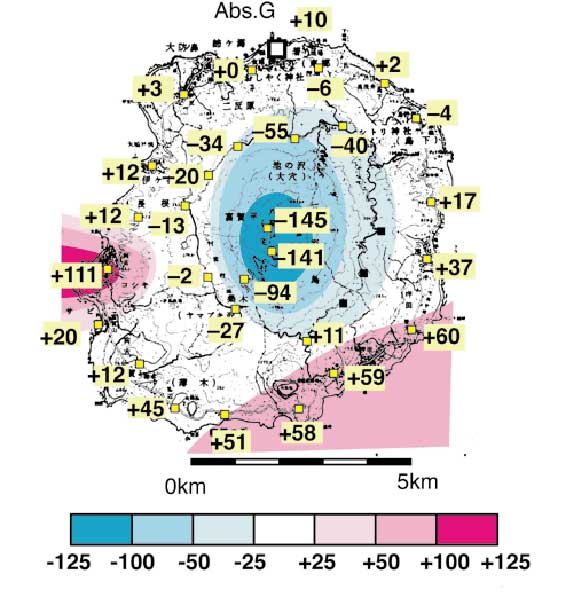
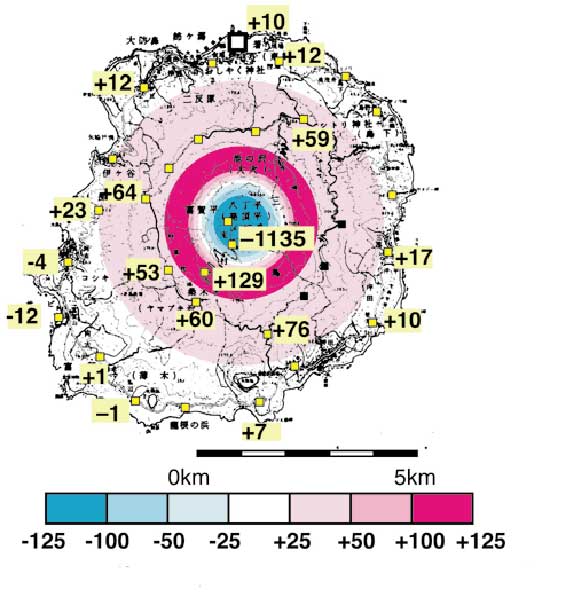
Fig. 12. (a) Telltale gravity decrease originates from the cavity
growing beneath the
caldera.
(b) Extraordinary gravity change exceeding 1000 microgal
suggested ever growing
caldera collapse since July to Aug. 2000.
・ Electromagnetic observations
1) The geomagnetic total intensity observation revealed a paired anomalous
change, at OYM and TRK
since mid-1996 (Fig. 13). This was ascribed to thermal demagnetization
at a depth of 700 m beneath
around the southern rim of the summit caldera.
2) Total intensity data indicated that the initial sinkhole was formed
within 4 minutes at the time of the
steam explosion on July 8. Magnetic data suggest that a non-magnetic
area (i.e. vacancy) was
generated initially at a depth of 2 km and moved toward the summit.
3) SP variations very similar to the velocity waveform of VLP pulses
were observed, together with
step-like changes in the total intensity. SP changes are attributed
to the movement of water, while
the magnetic field to the piezomagnetic effect. SP variations strongly
suggest that the forced injection
of vapor and/or water should take place into the surrounding rocks
around the source of the VLP
pulses.
4) Since July 8, the total intensity showed a large amount of changes
at several stations and it became
flat after the largest eruption on August 18 (Fig. 14). The model estimate
by approximating the hole as
a demagnetized disk cannot fully explain the observations: Thermal
demagnetization at depth should
have proceeded until August 18 and then it weakened. A large-scale
hydrothermal system might have
collapsed by the Aug. 18 eruption, as inferred from changes in SP during
the eruption.
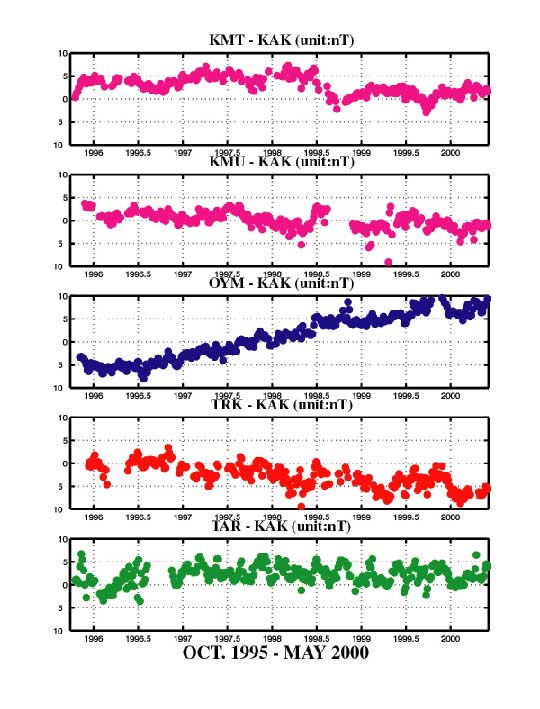
Fig.13. Changes in the geomagnetic total intensity in Miyake-jima
volcano (Oct., 1996
- May, 2000). 5-day means of simple differences relative
to KAK are plotted. OYM is
located in the summit caldera, while TRK on the southern
slope of the central cone
Mt Oyama.
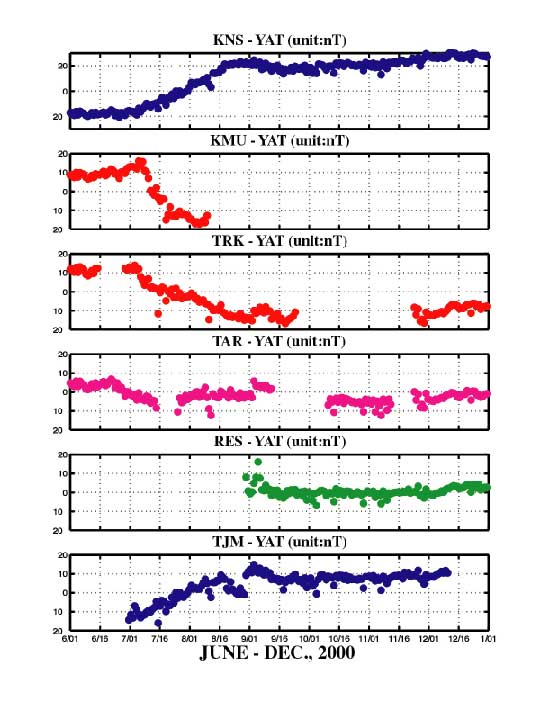
Fig.14. Changes in the total intensity at representative stations
on Miyake-jima island
(June - Dec., 2000). Daily means of simple differences relative
to YAT are plotted.
KNS, RES and TJM are located on the east and west sides,
while KMU, TRK and TAR
along the central N-S line of the volcano.
Top Next