Top Next
8-4. Division of Disaster Mitigation Science
Earthquake Engineering
The objective of earthquake engineering is to prevent or mitigate disasters,
especially damage to structures, caused by earthquakes.
Academic or practical methods of simulating or evaluating 1) design
earthquake motion, 2) response, 3) seismic performance, 4)
damage, or 5) risk, are developed and improved through observation,
experiment ( Fig. 1 and Fig. 2 ), analysis, and theory, for application
to seismic design, repair and strengthening of structures and ground.
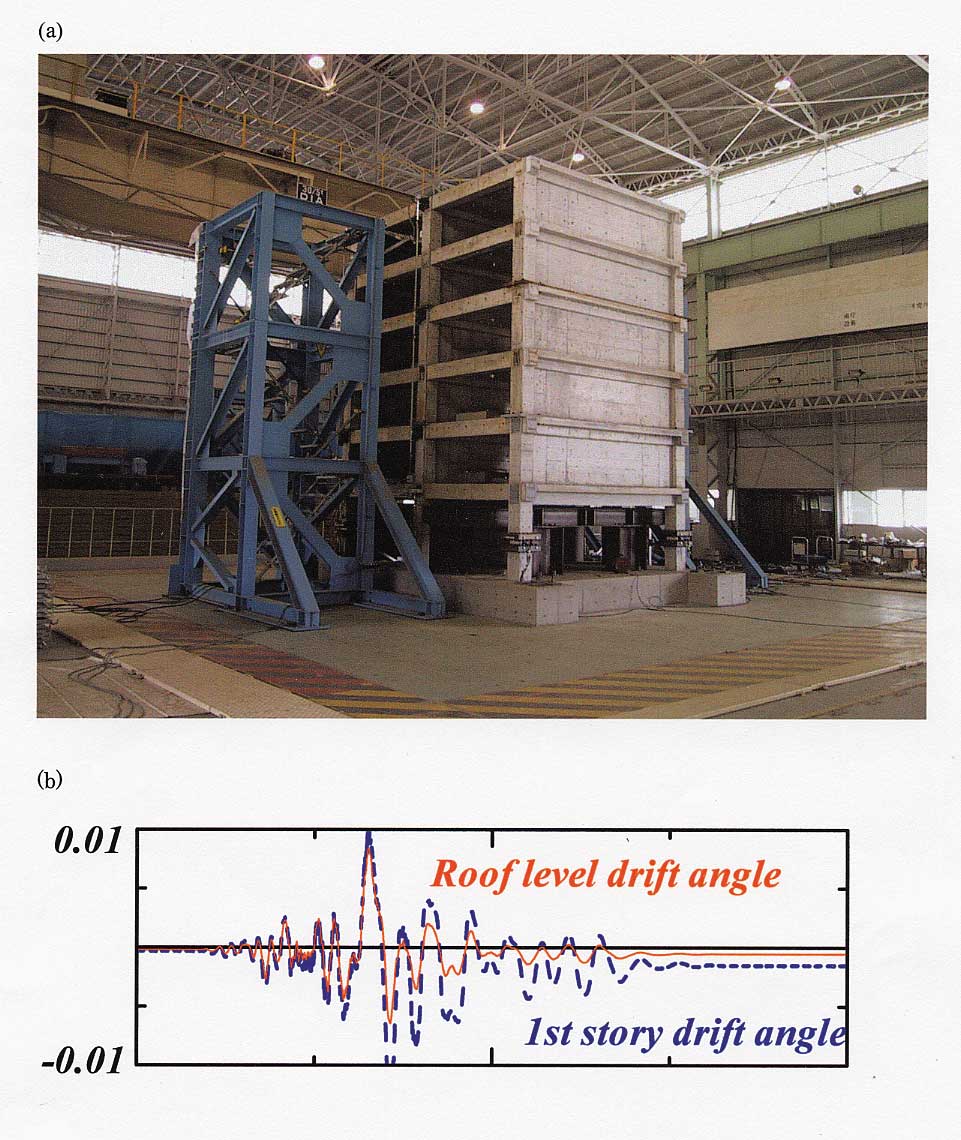
Fig.1. Shaking table test of 6-story one-third scale reinforced concrete
wall-frame building structure with soft
first story, July 2000. (a) Test specimen before test.
(b) Response of overall and first story drift angles to the
maximum input motion of equivalent Takatori 135 kine.
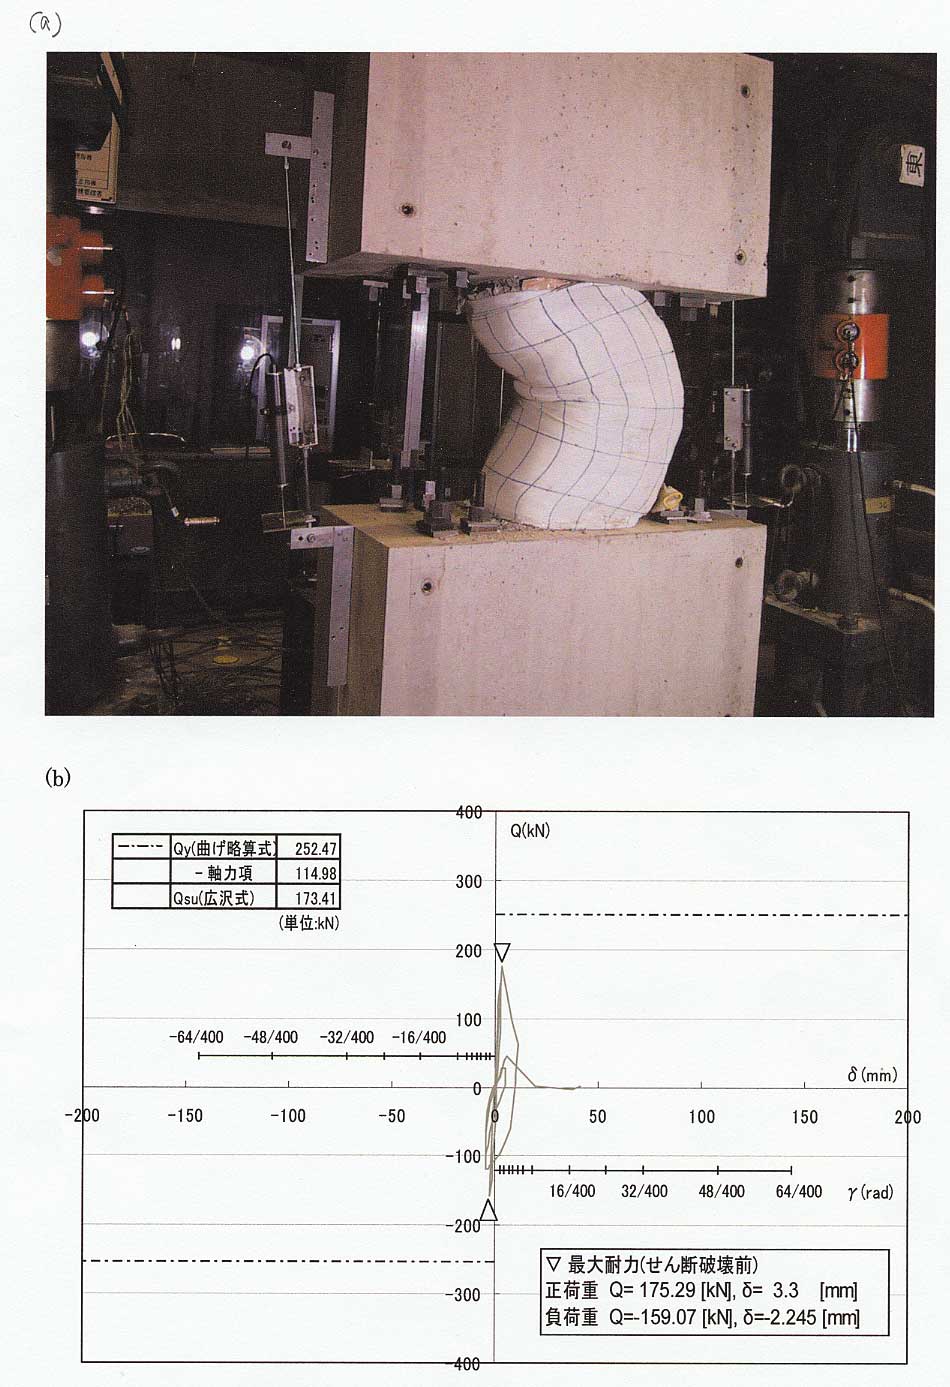
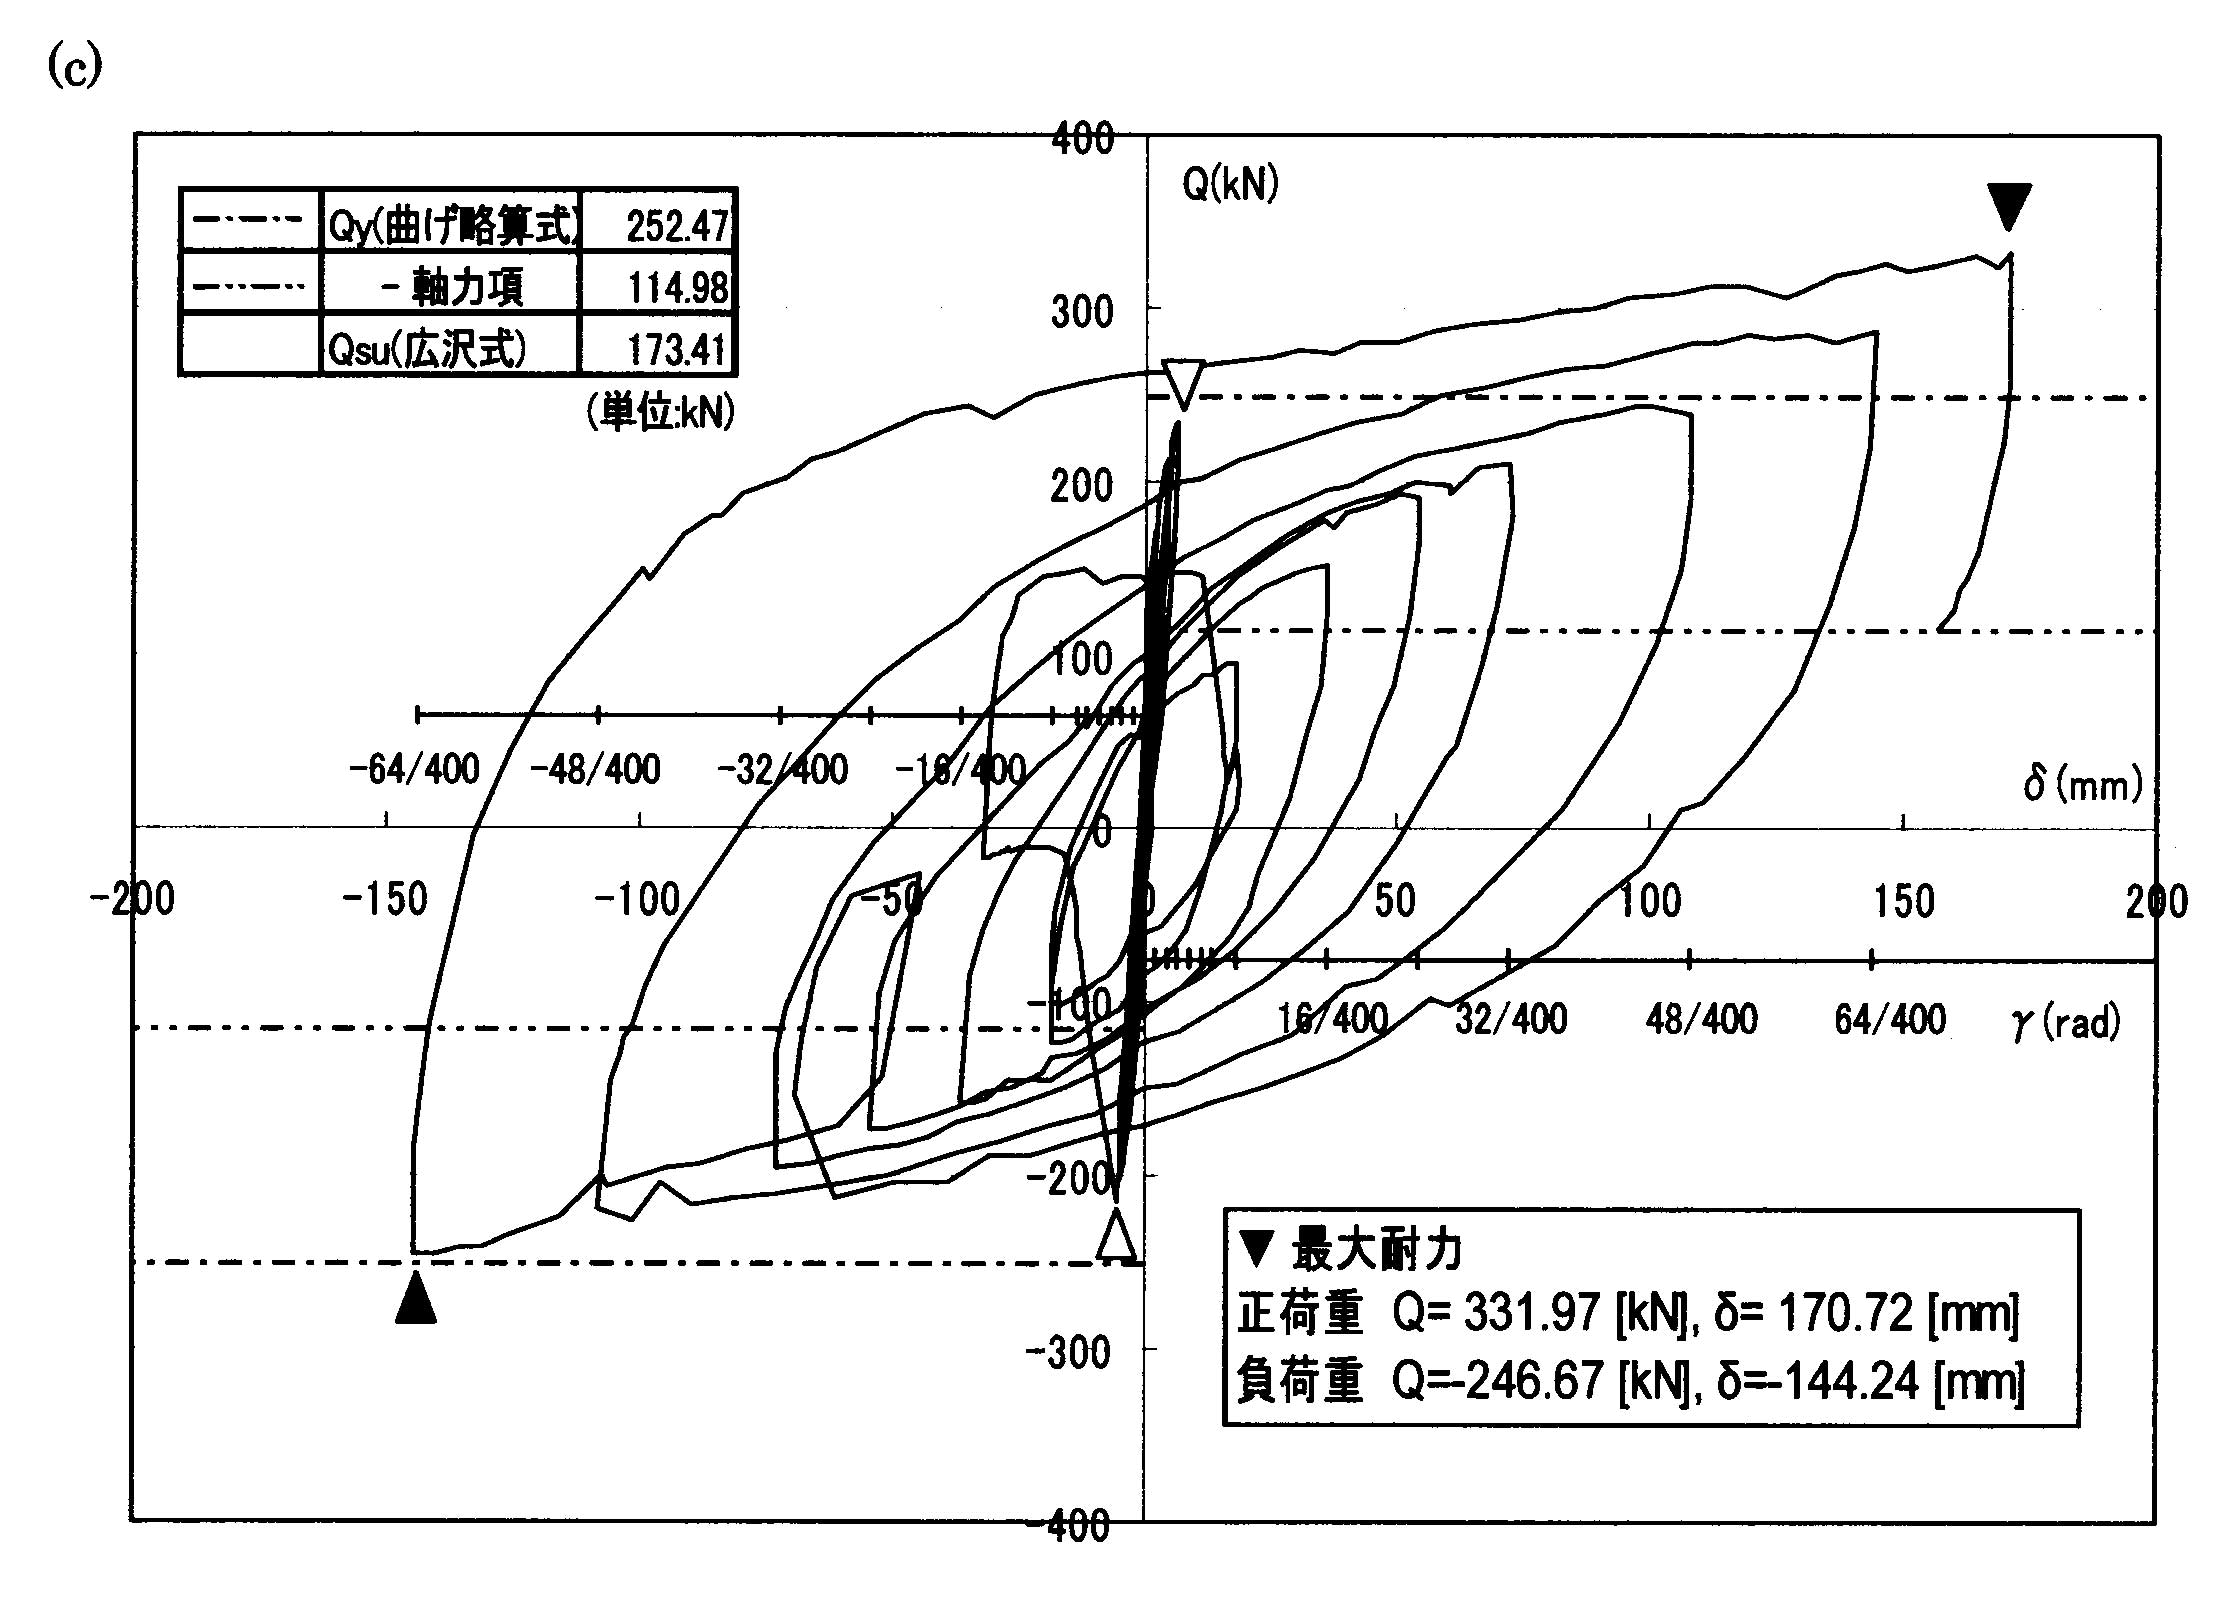
Fig.2. Performance verification test on a simple and economical method
of strengthening reinforced concrete
columns against axial load collapse during major
earthquake, August 2000. (a) Reinforced concrete specimen
strengthened with sheet after cyclic lateral load test.
(b) Hysteresis of reinforced concrete column specimen
without strengthening failed in shear and axial load collapse.
(c) Hysteresis of the column specimen strengthened
with sheet maintaining axial load capacity until amazingly high drift.
Damageability of strong ground
In order to mitigate earthquake disaster, we have to investigate damageability
of strong ground motions in addition to investigation of
strong ground motions and structures. Damageability of strong ground
motions, i.e., structural damage, is determined by the
relationship between intensity of strong ground motions and strength
of structures, therefore, we have to grasp characteristics of
both strong ground motions and structures. The result of the investigation
leads to index of representing damageability of strong
ground motions, such as J.M.A. (Japan Meteorological Agency) seismic
intensity. Such index is essential to grasp actual structural
damage rapidly and accurately for quick post-disaster response. Slow
post-disaster response enlarged human damage in the 1995
Hyogoken-Nanbu Earthquake. However, many strong ground motions records
are need to be obtained under the same structural
condition for such investigation. In the 1999 Chi-Chi earthquake, Taiwan,
many strong ground motions records were obtained under
the same structural condition. This made it possible to investigate
index of representing damageability of strong ground motions from
actual structural damage for the first time. The relationship between
often used index and proposed index (elastic response with a 5%
damping factor around 1.0 sec) and actual damage (area damage level)
is shown in Figs. 3 and 4, respectively. Almost no correlation was
found for PGA and a weak correlation for PGV, SI and JMA intensity
whereas, there is good correlation for proposed index with area
damage level.
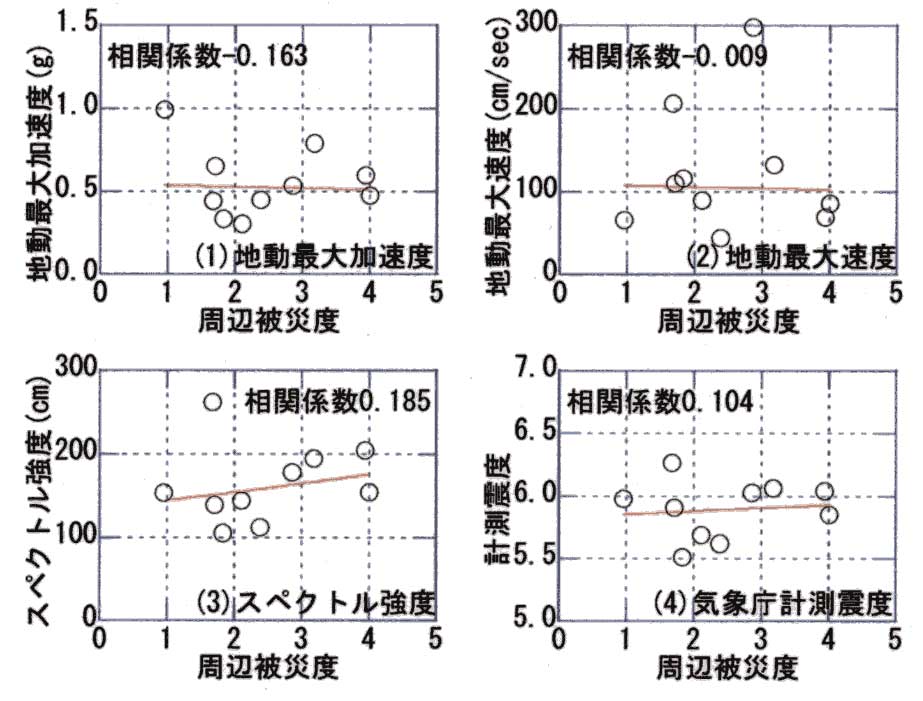
Fig.3. Relation between index of representing damageability and area
damage level
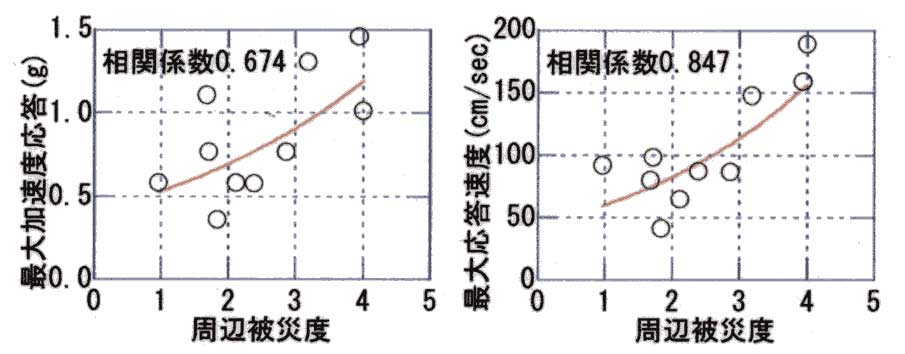
Fig.4. Relation between elastic response (5% damping for period
1s (left) and 0.8s (right)) and area damage level.
Applied Seismology
Seismologists are responsible for mitigating earthquake disasters, so
precisely estimating seismic ground motions is one of our most
important tasks. We are working on any problems related to this task,
and our recent research subjects are as follows:
1) Modeling earthquake faults and their rupture processes as sources
of seismic ground motions (e.g. Rupture process of the 1995
Kobe earthquake, Fig. 5).
2) Exploring detailed images of underground structures, which should
influence seismic ground motions (e.g. three dimensional ray
tracing in a subduction zone and tomographic analysis of explosion
data).
3) Numerical simulation of seismic ground motion caused by fault rupture
in a three dimensional heterogeneous structure (e.g.
simulation of strong ground motion caused by the 1995 Kobe earthquake,
Fig. 6).
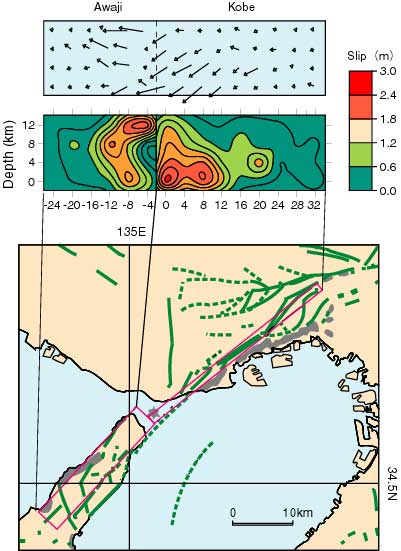
Fig.5. Fault model (lower) and its slip distribution (upper) for
the 1995 Kobe earthquake (after Yoshida, Koketsu et
al. 1996).
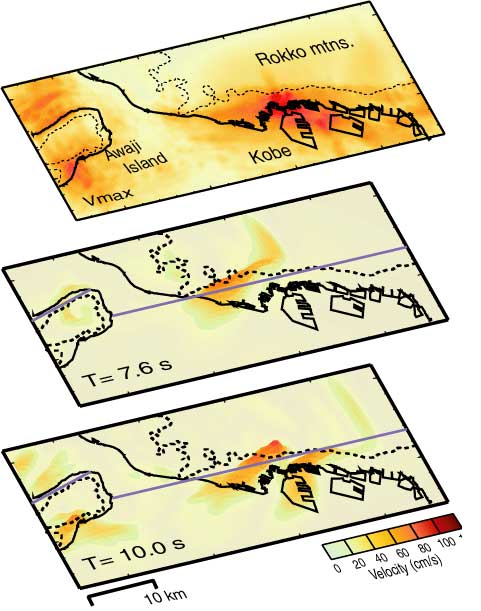
Fig.6. Numerical simulation of seismic ground motion caused
by the 1995 Kobe earthquake. The upper and lower
diagrams represent the distribution of peak ground
velocities and their temporal snapshots, respectively (after
Furumura and Koketsu, 1998).
Strong Motion Seismology
The major objectives of our research group are to understand the nature
of near-field strong ground motions and to quantitatively
estimate the effects of complex surface geology on strong motions by
mainly observational approaches. Strong ground motions at the
near-field contain high frequencies in the accelerogram (Fig. 7, the
first trace) as well as quasi-static movements due to near field
terms before the S-wave arrival in the displacement, as shown in Fig.7
(the third trace). On the other hand, events that are supposed
to be simple rupture have also been observed. Figure 8 shows the example
of simple and similar accelerograms, however, their high
frequency spectra and the waveform at later parts of pulses are significantly
different. This difference can be interpreted by introducing
a rupture deceleration model (Nakamura and Kudo, 1997).
Surface geology affects very much on strong ground motions. Figures
9 and 10 shows the relative intensity of 1-2 seconds ground
motions in Ashigara valley referring to a rock site. Areas showing
high intensity are found in the central and in the south-west of the
valley and they are correspond to a deepness of sedimentary basin.
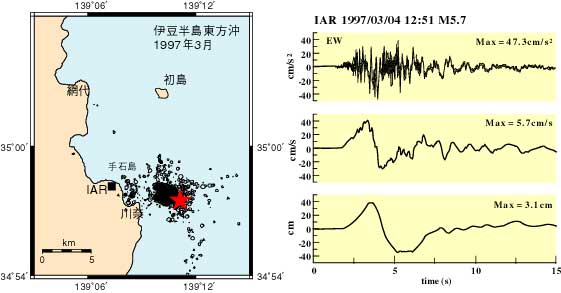
Fig.7. Observed acceleration, integrated velocity and displacement
(EW) at IAR form the 1997 Ito-oki earthquake
(M5.7).
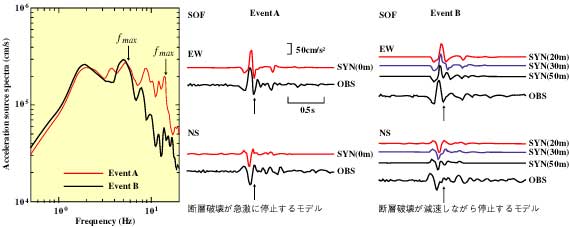
Fig.8. Two simple events differ at only high frequency. The
difference can be interpreted as that the rupture stops
suddenly (event A) and its velocity decelerates during 30m (event B).
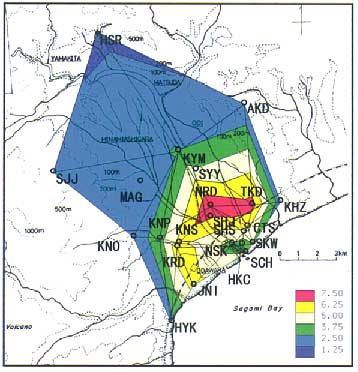
Fig.9. Distribution map of relative intensity of 1-2 sec. motions
in Ashigara valley estimated by using the records
of remote and large earthquakes (Uetake and Kudo, 1998).
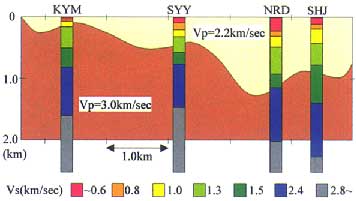
Fig.10. Underground structure models estimated by refraction surveys
and array microtremor measurements
(Kanno et al., 1998)
Strong Motion Estimates
Strong ground motion depends upon the causal earthquake fault, the propagation
path, and a variety of local sites near the ground
surface. We need to understand strong motion characteristics for earthquake-resistant
structure design and urban
earthquake-disaster prevention. Structure-soil interaction effects
must be taken into account in a soft soil area with a high seismic
risk. Fig. 11 shows the acceleration amplification of seismic wave
(-86m, -30m, 0m) due to very soft surficial layers.
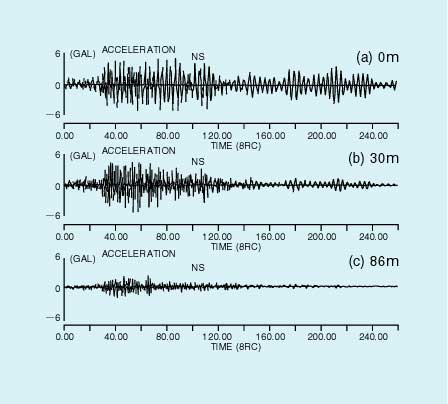
Fig.11. Acceleration amplification due to very soft surficial layers.
Numerical simulation of strong ground motion
The seismic wavefield is significantly affected by 3D variations in crustal
structure both in the source zone itself and in propagation
to some distance. Such effects can be modeled in large-scale numerical
3D simulation of seismic wave propagation by using parallel
computers. We developed a hybrid simulation code with pseudospectral
representation for horizontal coordinates and finite-difference
in depth. This arrangement improves parallel efficiency with high speed-up
rate using large number of processors (Fig. 12). Numerical
modeling of strong ground motion with a realistic 3D model for structure
in western Japan (Fig. 13) provide a good understanding of
seismic wave propagation from a subduction zone event such as the 1946
Nankai earthquake.
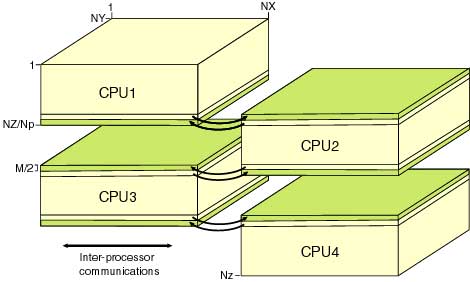
Fig.12. Schematic illustration of the PSM/FDM hybrid calculation.
The hybrid method offers fairly good speed up
rate even using large number of processors (Furumura, Koketsu and Takenaka,
2000).
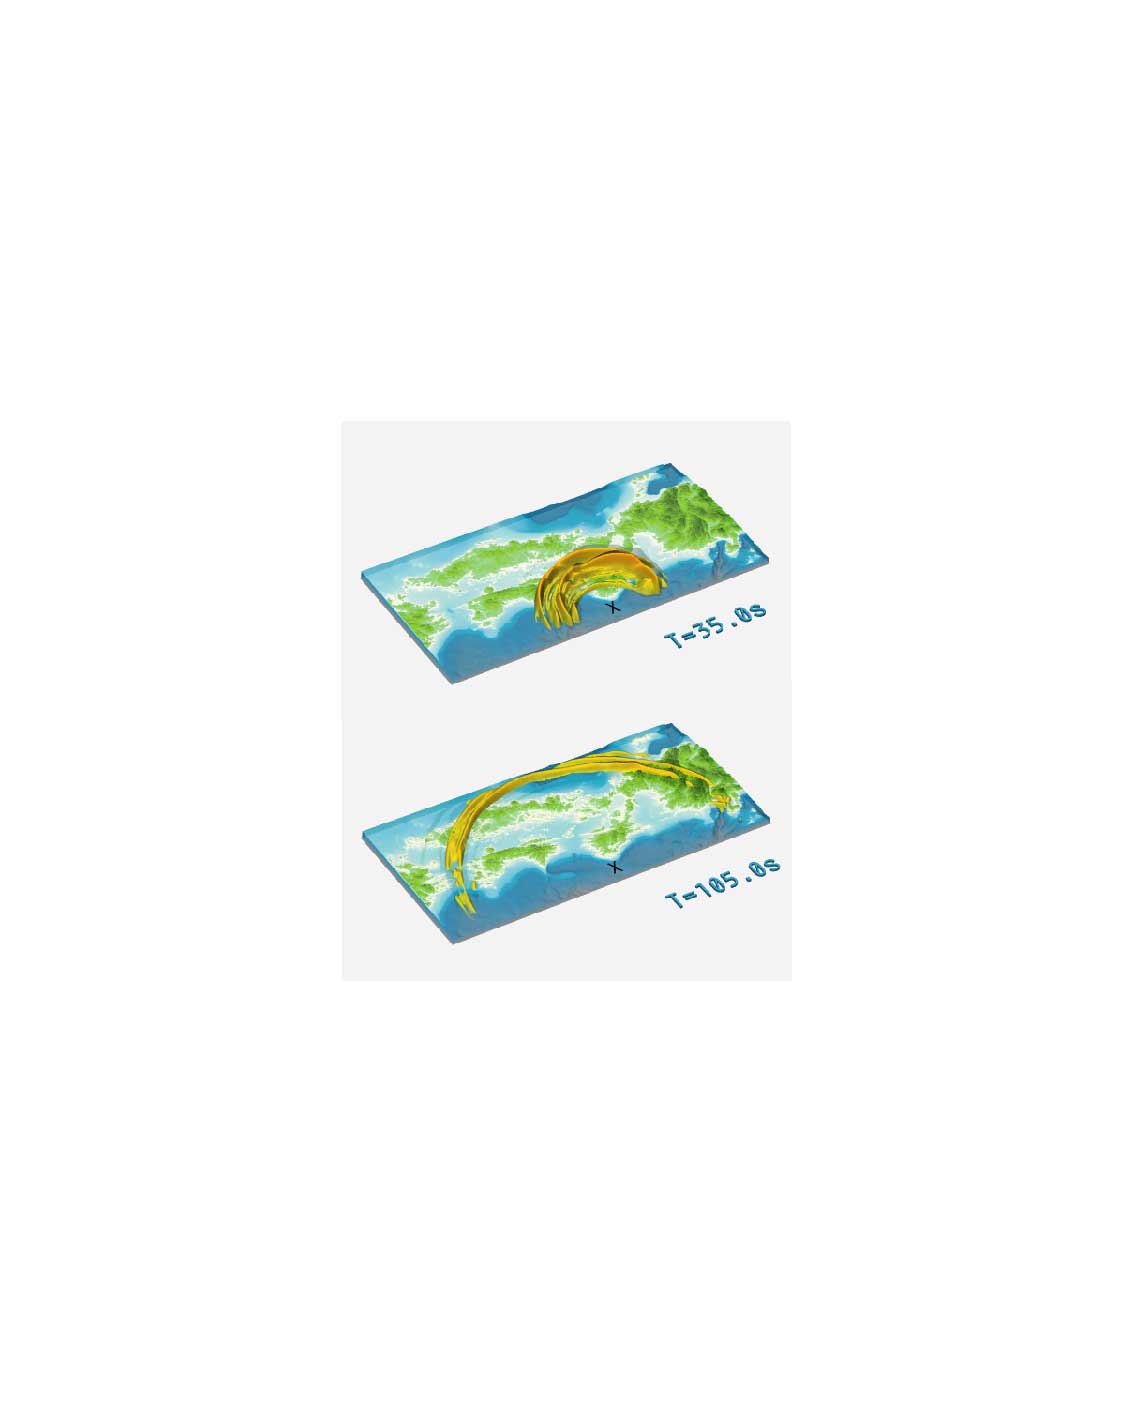
Fig.13. Snapshots of horizontal ground motion from 3D simulation
of wave propagation from a Nankai subduction
earthquake (Kennett and Furumura, 2000).
Tsunamis
A tsunami is a sea wave generated by a submarine earthquake. It has been
clarified that the magnitude of tsunamis in the sea regions
of Indonesia and Philippines exceed by one to two grades larger than
those generated by earthquakes of the same magnitude of the sea
region of the Japanese Islands (Fig. 14).
At midnight on June 3, 1994 an earthquake with a magnitude of 7.6
occurs in the sea region of East Java, and the inhabitants of
Pancer village felt a small tremor, but a huge wave with a height of
9 meters washed away almost all of the houses in the village.
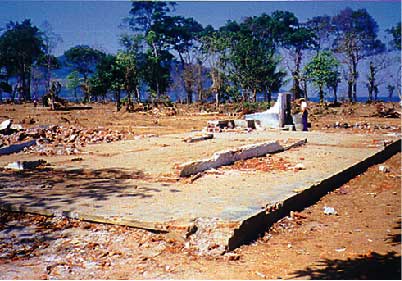
Fig.14. Almost all of the houses were washed away in Pancer village
by the tsunami generated by the 1994 East
Java earthquake.
Historical Seismology
We started the historical study on earthquakes in 1975. The documents
collected, which contain descriptions of earthquakes and
tsunamis, were published as a series of books, "Shinto-Nihon Jishin
Shiryo (New collection of materials for the study of historical
earthquakes in Japan)", which consists of 21 volumes, amounting to
16, 812 pages altogether. The materials collected are used in the
long-range prediction of earthquakes and the mitigation of disasters
caused by large earthquakes and tsunamis (Fig. 15).

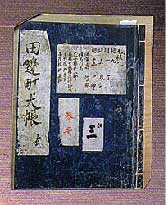
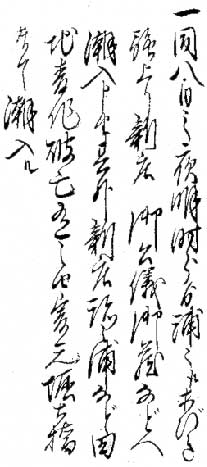
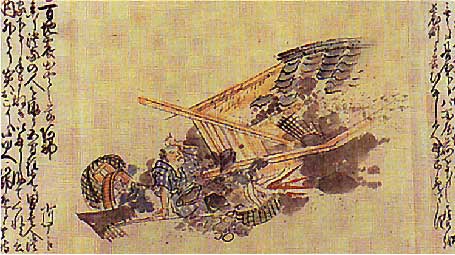
Fig.15. The tsunami records
in "Tanabe-cho Daicho" (The official diary of the mayor of Tanabe City).
Top Next