4-6. Eruptive activity at
Miyakejima volcano
Introduction
Abundant volcanic gas has
still emitted from the summit of Miyakejima volcano since September 2000,
though decreasing the extent; where vigorous eruptions had occurred during July
to August 2000, being accompanied by subsidence of the summit area. Magma’s
migration toward the Kozushima and Niijima islands, which generated the summit
collapse, is considered to have stopped on 18 August 2000, though the seismic
activity has still remained in a low level between the Kozushima, Niijima and
Miyakejima islands. In order to understand the eruptive phenomena in the
scientific point of view, ERI has carried out researches of seismicity, ground
deformation, electromagnetism, gravity and geology since the beginning of this
eruption (summer 2000), under the Steering Office on the Miyakejima eruption,
which was set up in June 2000. These researches had been supported by Tokyo
Metropolitan Government, Japan Meteorological Agency, Tokyo Fire Department,
Metropolitan Police Department, Japan Coast Guard, and so on. A part of
research results has been presented in the ERI homepage.
Geological research
Geological inspection from helicopters has been kept
regularly since September 2000, and the additional field survey on the eruption
products was carried out. The abundance and strength of volcanic smokes from
the summit had decreased with time, such that the bottom of active main crater
could be seen from helicopters (Fig. 1). Although dark smokes had been frequently
observed by the late 2000, since then, there were no further eruptions such
that ash deposits remained on the ground surface. Collapse of the summit
caldera wall had become less frequent. The field inspection of the deposits
reconfirmed that basaltic ballistics (bombs) of the 18 August 2000 eruptions
were erupted at high temperature. This was also supported by the study of
paleomagnetism on the bombs. Basaltic bombs are different chemically from
andesite spatters erupted under the sea on 27 June 2000. It is concluded that
two magmas with different compositions attributed to the 2000 eruption.
Petrological study on melt inclusions involved in plagioclase phenocrysts
showed that abundances of sulfur dissolved in parental melts were similar to
each other in basalt and andesite magmas, and, however, that the andesite
experienced mixing of magmas with different Cl abundances. The total volume of
eruption products is about 15 million m3, which occupies only about
2.5 % of volume of the summit subsidence (about 0.6 km3). Products
of individual eruption events contain blocks and fragments of old lavas more
than 60 %, except for the products of the 18 August eruption (about 40 %). The
present eruptions were much different from magmatic eruptions that used to
occur at Miyakejima. Grain-size analysis of these products characterizes the
latest eruption as high fragmentation and low dispersion, typical for magma’s
interaction with water (phreatomagmatic eruptions). It is likely that the
latter was possible in the condition that hydrothermal fluid was absorbed into
large cavities inside the volcano, which were formed by successive subsidence
of the volcano summit.
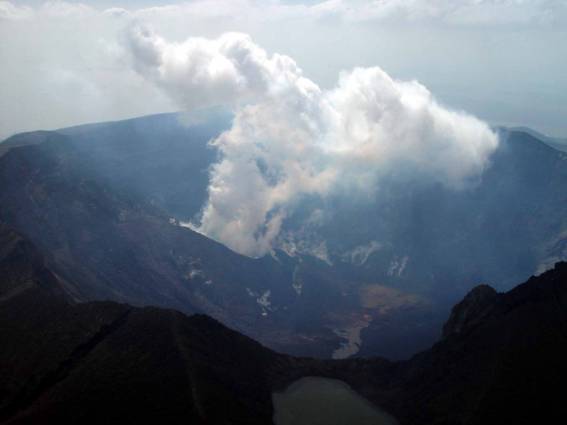
Fig. 1. Northern view of the summit caldera at
Miyakejima volcano. Craters smoking abundant sulfur dioxides are back. The
caldera is about 1.6 km across. Taken by M. Yoshimoto on 16 October 2002
・
Earthquake swarm
started under the Miyake Island
Earthquake
activity spread toward the northwestern oceanic region. It includes five large
earthquakes with the magnitude larger than 6.0 and a huge number of
earthquakes. To get better resolution for the spatial and temporal changes in
the activity, we conducted a series of pop-up and buoy telemetering ocean
bottom seismometer observations. The epicenter distribution obtained strongly
indicates a northwest-southeastern lineament (fig.2,3). The vertical
cross-section shows two trends; the deeper (7-13km) distribution forms a very
thin zone and the shallower (< 7km) distribution is much thicker. And it is
clear that the distribution of the hypocenters migrated horizontally and
vertically. This feature is important for understanding the behavior of the
magma migration.
Several strong
motion seismometers were also installed at the Izu-islands in the early stage
of the earthquake swarm. The tomography of Q−1 obtained from these data clearly indicates high
attenuation area in the straight between Miyake-jima and Kouzu-shima (orange
area in Fig. 4).
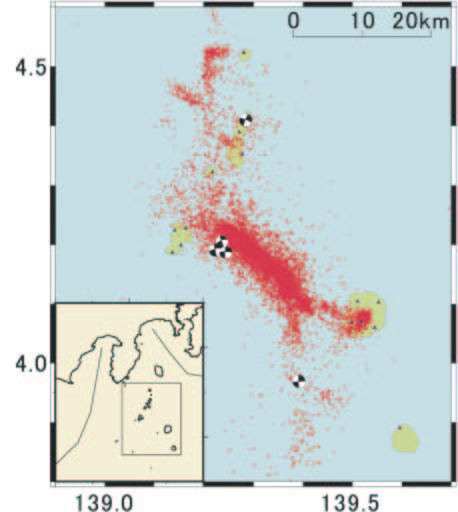
Fig. 2a. Epicenter
distribution (Jun. 26 - Dec. 31) and focal mechanisms.
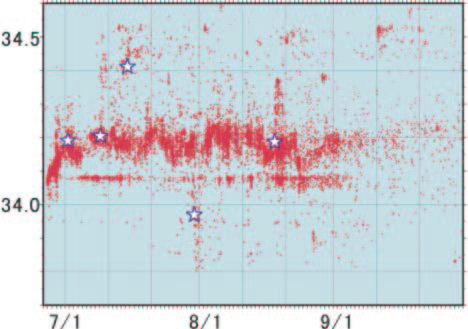
Fig. 2b. Time-space
distribution (Jun. 26 - Sep. 30).
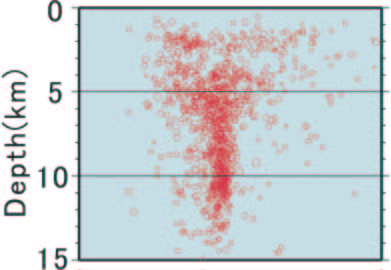
Fig.3.
Cross-section rotated 50 degrees.
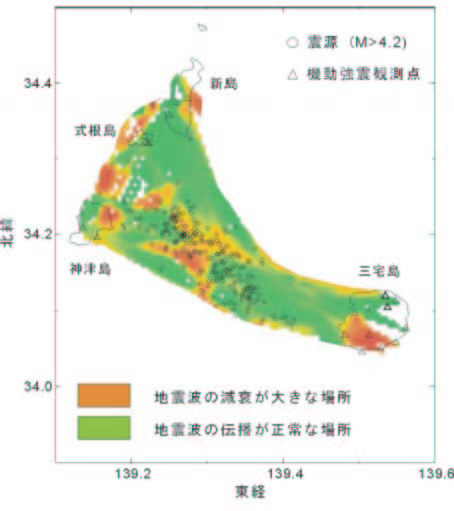
Fig.4.
Tomography image obtained from strong motion data.
・ Source Process of the
long-period seismic pulses
Very-long-period seismic pulses (VLP pulses) were observed a few times a
day from July 8 to Aug 18, 2000, synchronized with the step-like tilt increase
(Fig. 5).
The pulse width is 40 to 50 sec and is almost constant regardless their
amplitude. The occurrence of VLP pulses completely ceased after the summit
eruption on Aug 18. Waveform analyses of these signals show that the source
mechanism of these pulses is characterized by large volume expansion of 107 m3.
Several models have been proposed. One is an intermittent subsidence of a piston
in the volcanic conduit (Fig. 8). Another is an underground vapor expansion
model (Fig. 7).
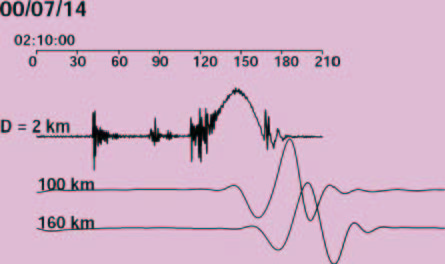
Fig.5.
Example of 50s-seismic pulses (2:10 July 14th). KAS: broadband
seismometer in the Miyake-jima, JIZ and FUJ (NIED): broadband seismometer in
Honshu.
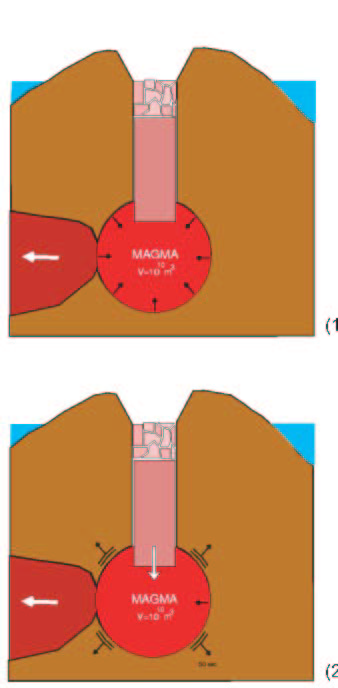
Fig. 6.
"Piston drop model". Step 1: Pressure in the magma reservoir
gradually decreases with steady magma flow from the reservoir. Piston has not
yet started descending due to reservoir pressure and friction. Step 2: As
reservoir pressure decreases down to some threshold, side friction is not
enough to stop the piston from sliding down. The piston slammed into the magma
causing reservoir pressure increase which generates a very-long-period seismic
pulse.
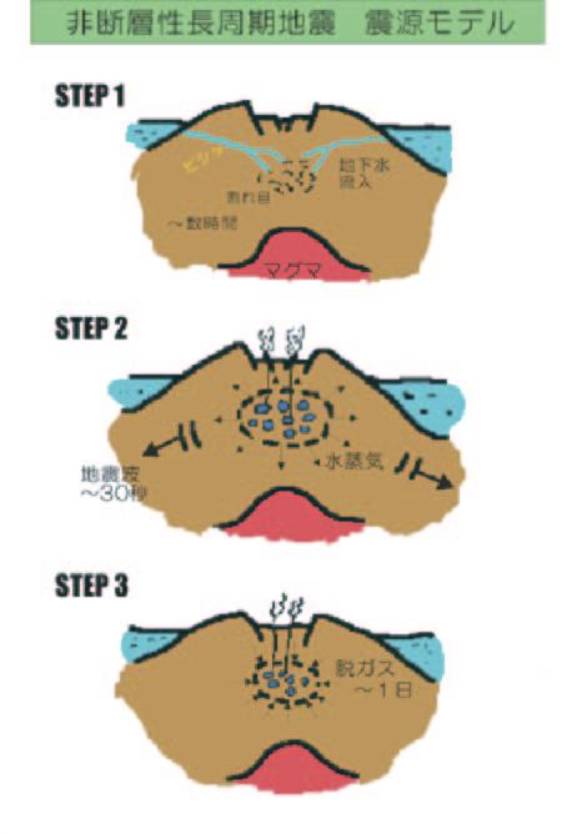
Fig.7.
"Underground vapor expansion model". Step 1: The groundwater
gradually permeates the cracks under the summit and approaches high-temperature
region. Micro earthquakes are triggered at this stage. Step 2: The groundwater
is heated into a state of overheating inflation, which causes very-long-period
pulse. Step 3: While the expanded steam passes through the cracks, it is cooled
into water. Accordingly Mt. Oyama is slowly contracted.
・ Magma Intrusion inferred from a
dense GPS network
To detect ground deformation in Miyake-jima volcano, dense GPS
observation has been carried out since 1995. Total number of observation points
is about 45. During the period of the last activity, the results of GPS
observation showed very large ground deformation and revealed the magma
movement and associated phenomena. On June 26, 2000, the dike accompanied with
the earthquake swarm intruded toward the northwest into the sea from the
central part of the volcano (Fig.8). On 8 July, a summit eruption occurred and
the collapse around the summit area was observed and developed into
intermittent eruptions from the summit crater. In this period, the ground
deformation was caused by an isotropic contraction source located under the
summit area and the dike contraction. Since the beginning of September 2000,
huge amount of the volcanic gas had been constantly released from
the vents in the summit caldera. The ground deformation in the period was
caused by the similar isotropic source as before. We analyzed the GPS data from
September 2000 to June 2001 and determined the daily positions of GPS stations.
The result (Fig.9) indicates that there is one pressure source at a depth of 5
km under the southern slope just outside the summit crater and the rate of
volume change is -3.8x10⁶m3/month. The rates of magma volume change are
estimated to be -2.5x10⁶ to -6.0x10⁶ m3/month assuming that the volcanic gas is
emitted from the liquid magma. Because the rates of volume change estimated
from the GPS survey are almost equal to those from a estimation of the volume
contraction of magma by degassing, we could propose a plausible model that the
volume of the magma reservoir decreased corresponding to the amount of the
volcanic gas components released from the magma in the reservoir.
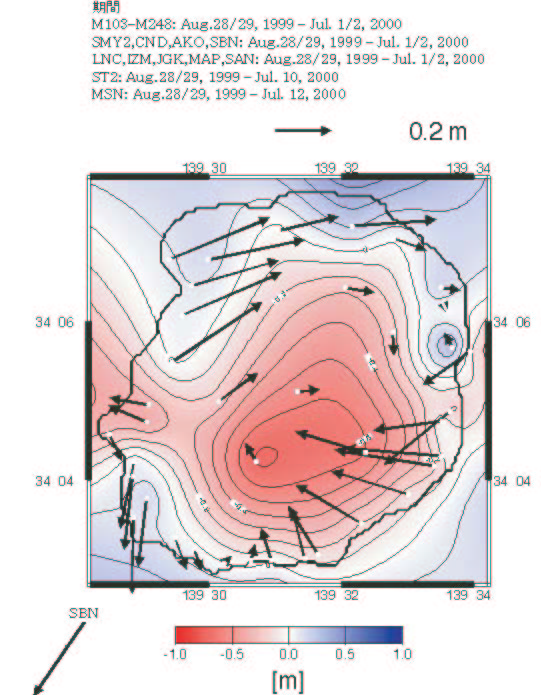
Fig.8. Crustal deformation detected by GPS observation on June 26,
2000. Arrows show horizontal displacements. Vertical displacements are
indicated by contourlines and color.
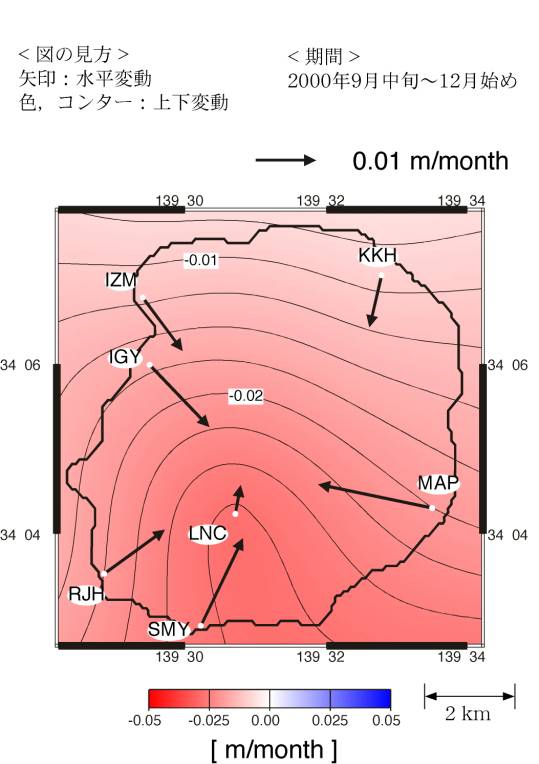
Fig.9. Crustal deformation detected by GPS observation from September
2000 to June 2001. Arrows show horizontal displacement rates (m/month).
Vertical displacement rates (m/month) are indicated by contourlines and color.
・ Continuous observation of
absolute gravity at Miyakejima volcano
At Miyakejima volcano, we have frequently carried
out hybrid microgravity
measurements. Of a number of remarkable gravity changes are
an evidence of dike intrusion immediately after the onset of volcanic
activity, a discovery of void space beneath the summit immediately before the
caldera collapse, an evidence of lateral magma flow in
the stage of caldera collapse and so forth. Because the electric
outage at Miyakejima was restored after May 2000, we started continuous
observation of absolute gravity at Miyakejima volcano. To our
knowledge, there are no such reports of time-continuous monitoring of
minute changes in absolute gravity near active volcanos. Though the measurement
itself is automatic, we visit the volcano island via a helicopter
as frequent as once per a week on the average, and carefully
check the status of the meter in order to keep the apparatus in
good condition. As a result, from October to November 2001 when a volcanic glow
was observed, we detected a gradual increase in gravity which
could not be explained by ground subsidence (Fig.10). On account of both the
temperature increase nearby the vent and the abrupt increase in the
sulfur dioxide discharge at that moment, the temporal gravity increase
was presumably caused by the ascent of a magma head. Meanwhile,
the gradual increase after January 2002 will be explained by
the ascent of water level.
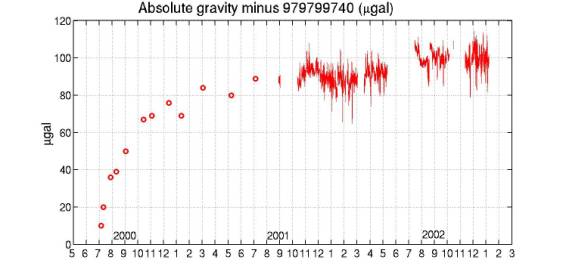
Fig.10.
Absolute gravity changes at Miyakejima weather station at the northern
edge of the island. Unit is in microgal; 1 microgal is about10⁻⁹cm/s².
・ Electromagnetic observations
Geomagnetic total intensity, self potential and resistivity
observations have been carried out since 1995 in cooperation with the researchers
in Japanese universities, French LGO-OPGC and USGS. The geomagnetic total
intensity observation revealed a significant change (Fig.11), which indicates a
thermal demagnetization at a depth of 700 m beneath around the southern rim of
the summit caldera. Magnetic data also suggest that a non-magnetic area (i.e.
vacancy) was generated initially at a depth of 2 km and moved toward the summit
before the first collapse on July 8, and this sinkhole was formed within 4
minutes at the time of the steam explosion. SP variations very similar to the
velocity waveform of VLP pulses were observed, together with step-like changes
in the total intensity.
After September, 2000, securing of the electric power and the
communication became difficult because of a large quantity of volcanic gas
emission and mud flows.
Electromagnetic research group has extensively established a
transmitting system of the total force of geomagnetic field. Fig. 12 indicates
that temperature in the shallow part beneath the crater has been increased in
recent one year, but turned to decrease from July 2002.
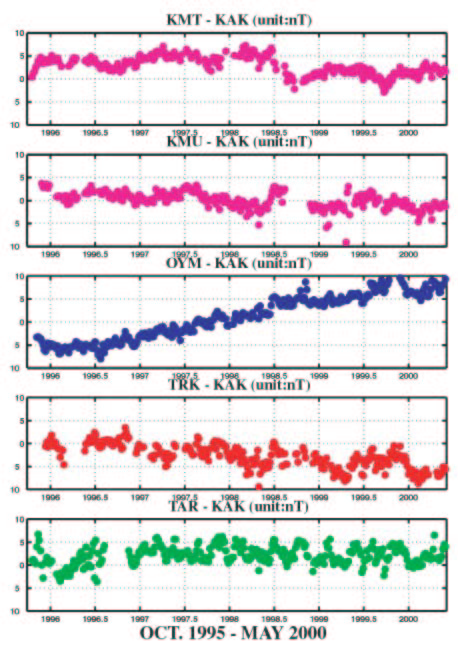
Fig.11. Changes in the
geomagnetic total intensity in Miyake-jima volcano (Oct., 1996 - May, 2000).
5-day means of simple differences relative to KAK are plotted. OYM is located
in the summit caldera, while TRK on the southern slope of the central cone Mt
Oyama.
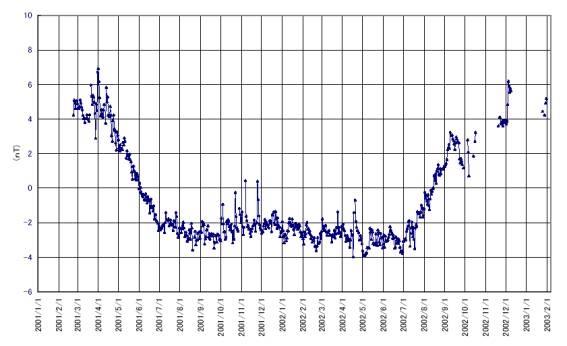
Fig.12. Total intensity of geomagnetic field in the southern side of
the caldera. Temperature in the
shallow part beneath the crater has been increased by July 2001, and turned to
decrease from July 2002.