Launched: March 2, 2010
Updated: March 4, 2010
An earthquake of magnitude 8.6 has occurred in Chile, South America, at 3:34pm, February 27th, 2010 (Japan time. Local time, 3:34am). Due to the massiveness of the earthquake, there has been major damage in the area. The tsunami reached the East-coastal areas of Japan and the height was around 1m.
The location of the epicenter is as follows, according to USGS; 35.846°S, 72.719°W, 35km deep.
(Outreach and Public Relations Office)
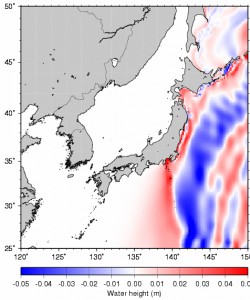
[ Tsunami Simulation ]
<simulation of the tsunami>
<map of the vicinity of Japan>
(by Professor Kenji SATAKE )
[ Waveforms observed by J-array ]
The new J-array earthquake waveform database uses the network to resemble a giant array and collects the seismogram realtime from all over the world and is put int o the database. At the moment, all three components of the waveform data from about 400 stations placed by universities and the JMA are collected through the high-speed ground network. Seismogram is sampled in 20Hz. transformed into and saved as J-array Standard Waveform Data.
(Earthquake Information Center)
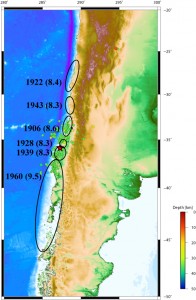
[ Aftershock Locations ]
Above is the main shock located by USGS and the aftershocks until 5:13am, February 28 (GMT) plotted in a red star and circles, respectively. The oval sections are the approximate faults of the historical earthquakes. (Reference:Kelleher, 1972, Fig. 1)
(by Assistant Professor Satoko Oki)
[ GPS tsunami recorder off coast of Muroto ]
Show realtime data of the GPS tsunami recorder off Muroto (time lag of about 30sec.)
The upper waveform indicates the ocean waves (short period), and the bottom indicates the tsunami (long period: moving avg. deviation of 60sec.)
Vertical axis may be adjusted.
The same GPS buoy is located by the Ministry of Land, Infrastructure, Transport and Tourism, along the coast of the Tohoku area. The recorded data of the GPS buoy can be accessed here. Although the distinct difference in its appearance due to its main objective to observe the tidal level off shore, data will be recorded if the tsunami is predominant enough.
(by Professor Teruyuki KATO)
[ Source process inversion of teleseismic body waves ]
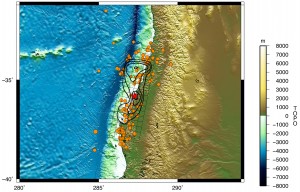
The left image below is the surface projection of the slip distribution. The moment magnitude is calculated to be 8.63, and the maximum fault slip is 9.4mm. The fault length is estimated to be 450-500km long.
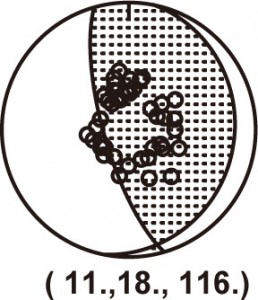
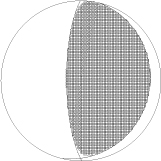
To the right is the focal mechanism. It is a reverse fault with a strike and dip of 11° and 18°, respectively.
click to enlarge
( by Natalia Poiata and Professor Kazuki KOKETSU)
[ Source Mechanism by W-phase seismogram ]
strike: 13.4°
dip:15.1°
Mw:8.8°
(by Yusuke YOKOTA)
[ Sea surface change captured by the ocean bottom cable seismometer placed offshore Sanriku ]
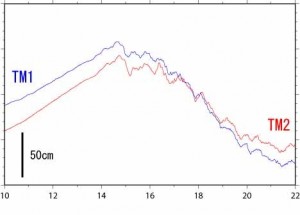
Below is data recorded by the ocean bottom cable seismometer/tsunami meter system. This system is placed offshore of Sanriku. The big heave shows records of tidal levels. The waveform from before 2pm is the change of water pressure below the surface (=change of sea surface) due to the tsunami caused by the earthquake.
 (by Associate Professor Shinichi SAKAI)
[Seismic waves that travel the surface of the earth]
The seismic waves can be separated in two types –body waves and surface waves. Body waves travel inside the earth, whereas surface waves are the long-period waves that travel along the surface of the earth. If the magnitude of an earthquake is large and the epicenter is shallow like this earthquake in Chile, surface waves would be observed traveling many times around the earth. Analyzing the worldwide IRIS seismic networks, and the F-net Broadband Seismic network in Japan, we have verified that the surface waves due to this earthquake have circled the earth five times.
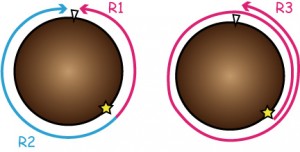
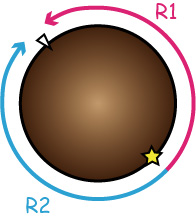
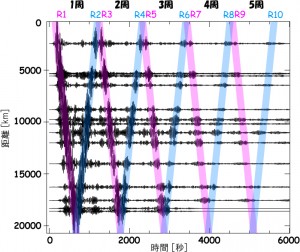
One of the surface waves, the Rayleigh wave, is distinguished as below depending on the direction it travels the surface of the earth. The wave that traveled along the minor arc is called R1, and the major arc is called R2. After R1 travels around the earth and returns to the epicenter and continues to circle the second time, it is named R3, and if the same can be observed with R2, its second round will be called R3, and so forth.
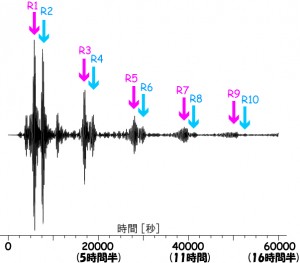
Below is the observed surface-wave data at the Ogasawara Observation Staion (Chichi-jima) after a 200-300 sec. filtering in order to make the surface waves to be recognized easier. 0 in the lateral axis is the earthquake origin time. The first peak indicates R1, and the second peak right after it is R2. The fact that there is scarcely any time difference between the minor arc R1, and major arc R2, is because the station (Ogasawara, Japan) is almost right on the other side of the earth from the epicenter (Central Chile).
Following is the observed data from stations around the world, in order of distance. One set of waveform is the data from one observation station (refer image above). The 20,000km point is around the other side of the earth of the epicenter. You can see clearly, that R1 is observed from the closer stations moving on to farther stations, with a total of five runs.
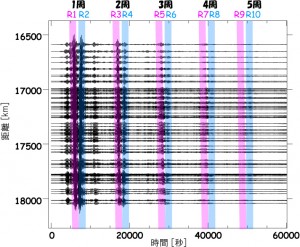
Similarly, below is the data analyzed with the F-net, the seismic network in Japan. As stated above, R1 and R2, R3, and R4…are seen right next to each other, since the epicenter is on the other side.
These phenomena were observed in the 2008 Shicuan Earthquake in China (6 runs) and in the Earthquake off Sumatra in 2004 (8 runs) as well.
F-net data: by F-net observation network at NIED
(by Assistant Professor Satoko OKI)

