Kimihiro Mochizuki
Marine Seismology @ ERI, U-Tokyo
Japan Trench off Sanriku
(Northern boundary of Tohoku-oki EQ focal area)
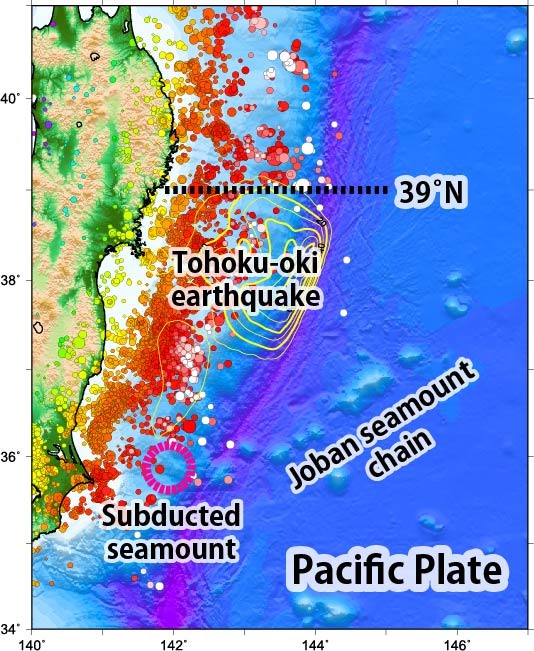
The Pacific plate is subducting west-northwestward at a rate of about 10 cm/year along the Japan Trench. The activity of interplate earthquakes along the subduction zone is not uniform, and those earthquakes are particularly active north of 37°N. The 39˚N latitude corresponds to the northern edge of the epicentral region of the 2011 Tohoku-oki earthquake (Tohoku-oki earthquake), and there is a clear seismic activity gap. We conducted an active source seismic survey to understand the factors that cause the heterogeneity of the seismic activity.
Mochizuki, K., M. Nakamura, J. Kasahara, R. Hino, M. Nishino, A. Kuwano, Y. Nakamura, T. Yamada, M. Shinohara, T. Sato, P.P. Moghaddam and T. Kanazawa, Intense PP reflection beneath the aseismic forearc slope of the Japan Trench subduction zone and its implication of aseismic slip subduction, J. Geophys. Res., DOI:10.1029/2003JB002892, 2005
Seismic activity heterogeneity across 39˚N
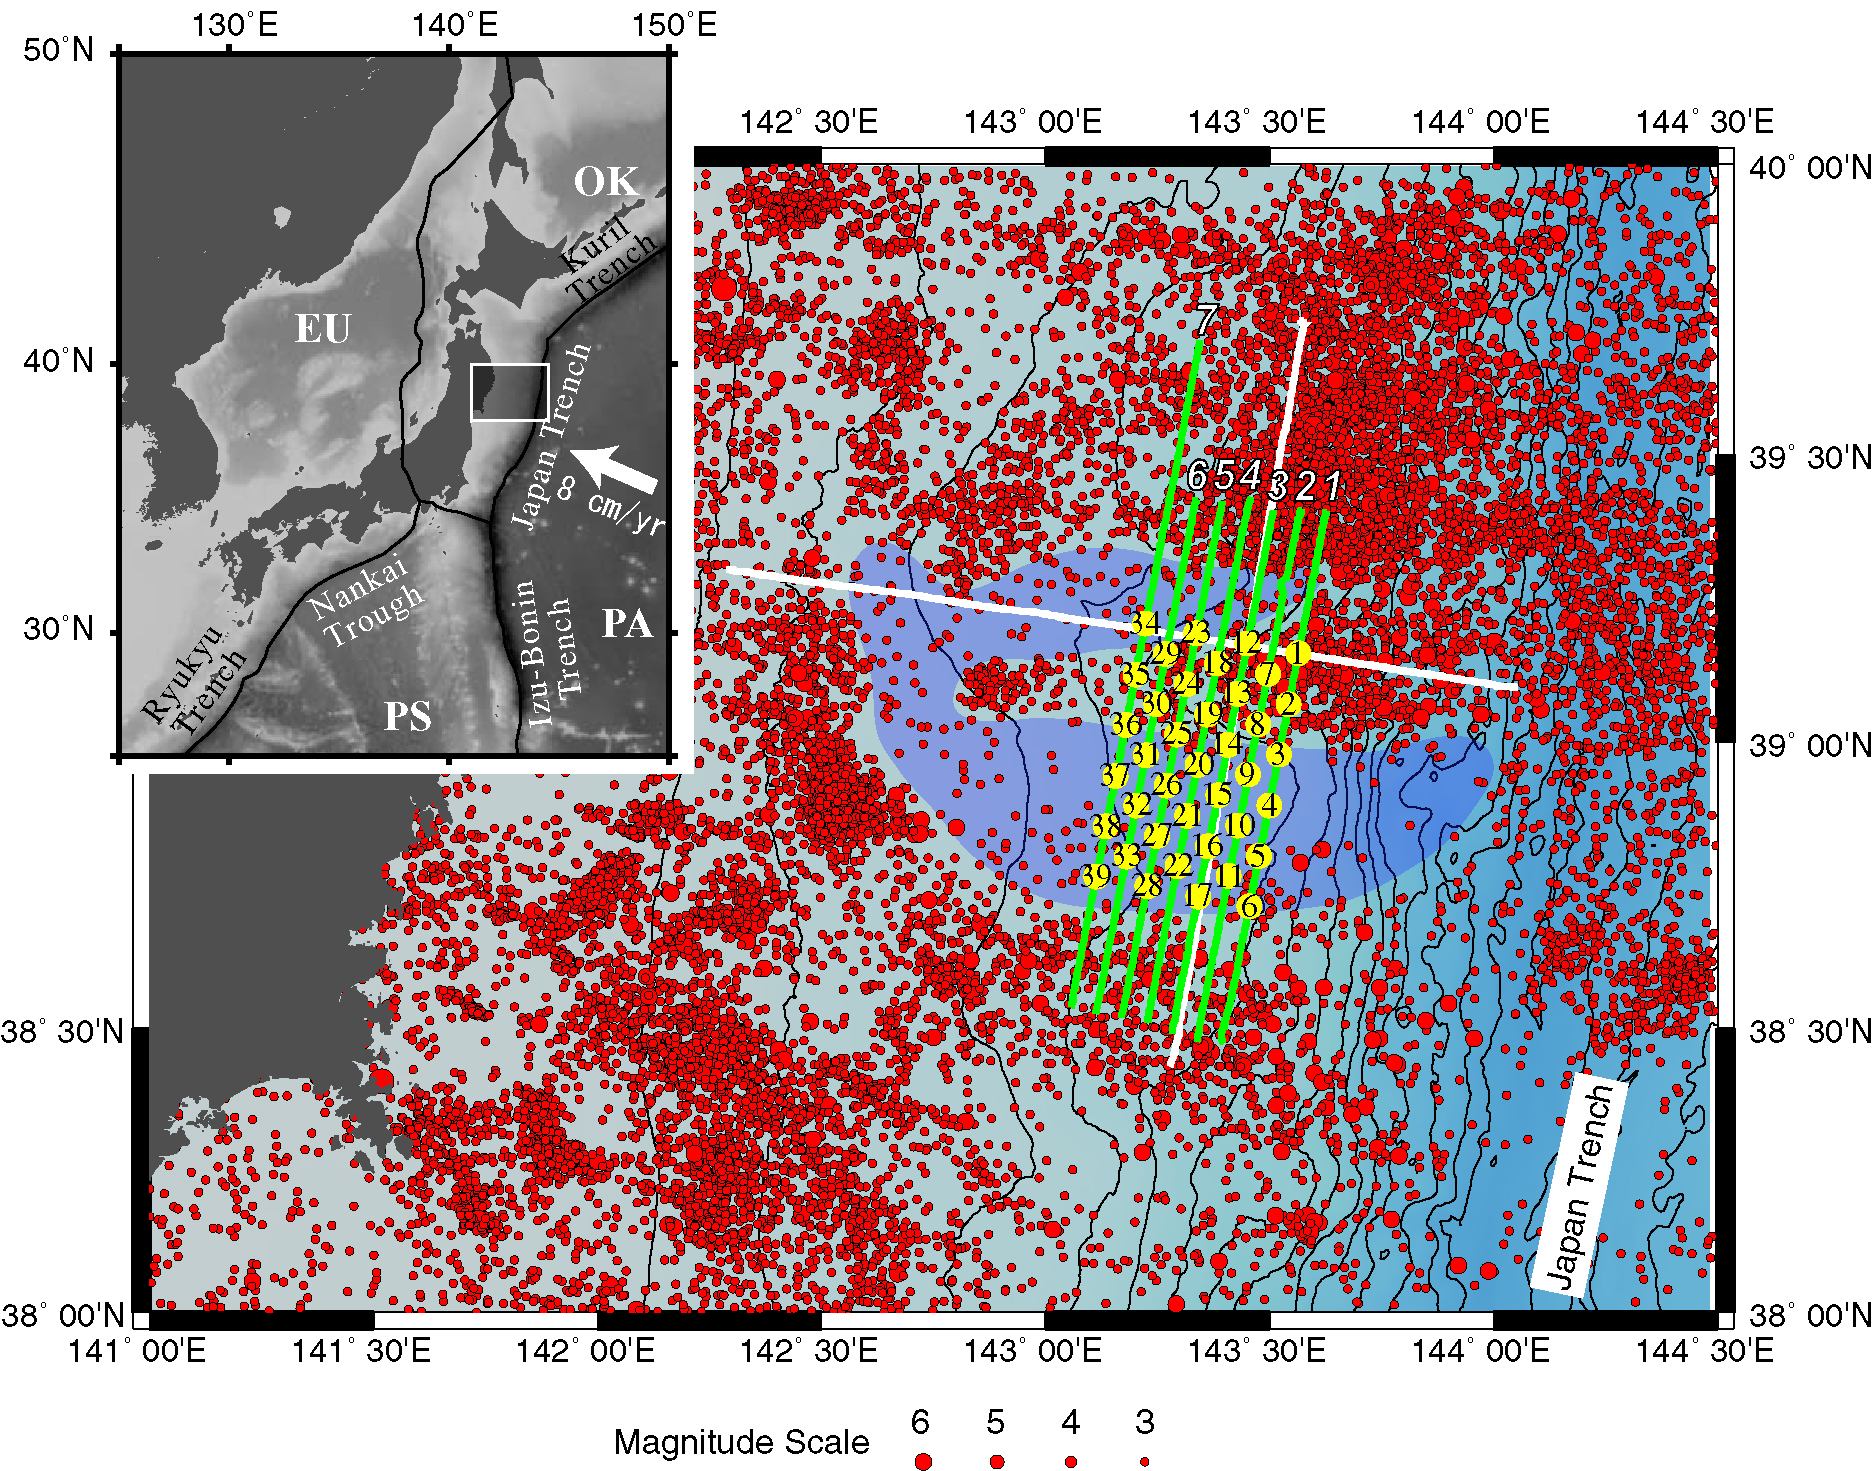
Seismicity is active to the north of latitude 39˚N along the Japan Trench, while there is a seismic blank area where almost no seismic activity is seen to the south (blue area in the figure). An active source seismic survey conducted in 1996 along the cross lines (white lines in the figure), one of which aligns the strike of the trench axis, confirmed that there was a large contrast in seismic reflectivity at the plate interface across this seismic activity boundary (Fujie et al. ., 2002). It was found that the plate interface reflectivity is strong in the seismic activity gap south of 39˚N, whereas it is weak in the seismically active region north of 39˚. In order to investigate the relationship between the seismic activity and the extent of the plate interface reflectivity, we conducted another active source seismic survey in 2001 along the subduction zone along seven profiles (green lines in the figure, yellow circles are ocean bottom seismometers) and obtained good records along five landward profiles (lines 3 to 5).
Distribution of seismic activity and plate interface reflectivity
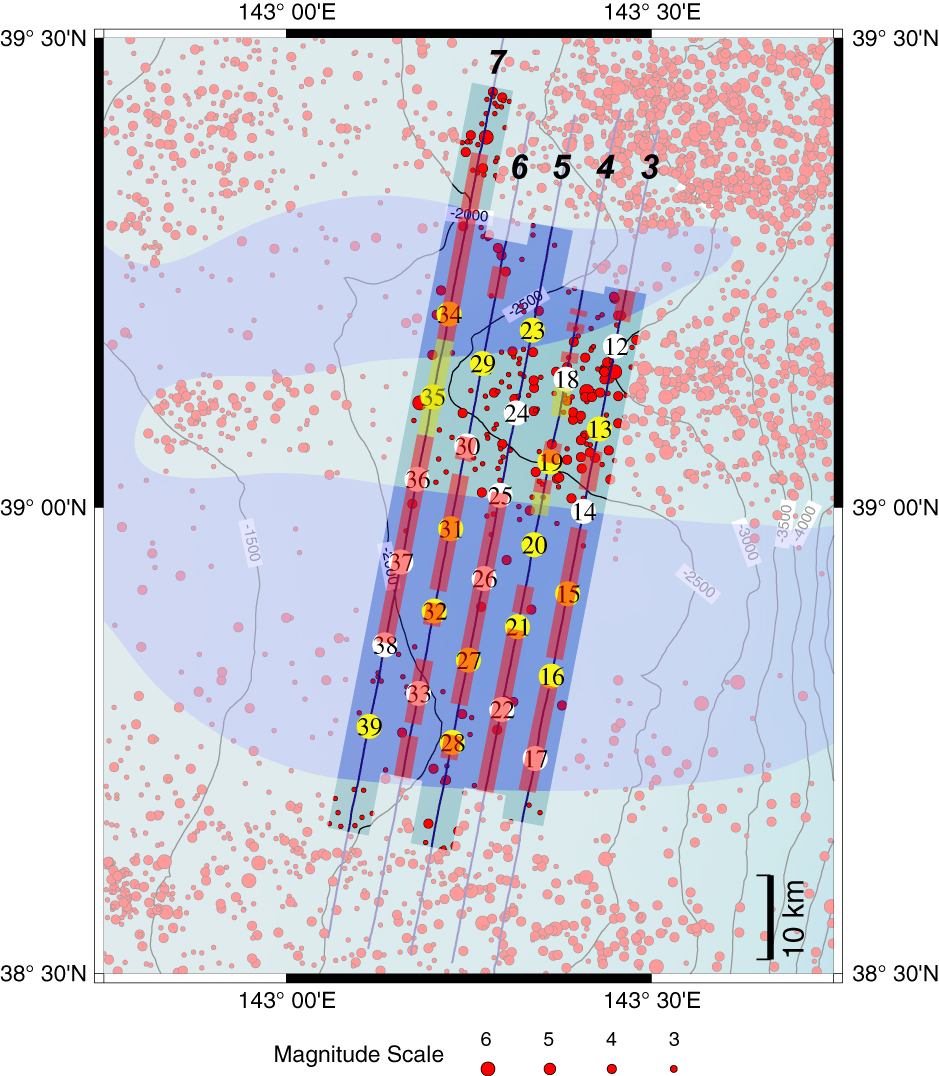
The Reflection amplitudes of active seismic sources from the plate interface recorded by the ocean bottom seismometers was mapped on the survey profiles after application of necessary corrections such as geometric attenuation. A good anti-correlation was found between the plate interface reflectivity and seismic activity on all five survey profiles. The reflectivity is small in the area with high seismic activity, and strong reflection amplitudes from the plate interface were confirmed in the area with no seismic activity (red area on the survey line). It was clarified that the two-dimensional anti-correlation between reflectivity and seismic activity observed at the cross lines in 1996 also holds on the extent of the plate interface.
The reflectivity at the plate interface can only be explained by a large contrast in seismic wave velocities across the plate interface. Numerical simulations were carried out to investigate the factors that produce the reflected amplitudes at the plate interface. If the P-wave velocity is faster in the subducting oceanic crust across the plate boundary than in the upper plate side, the reflected wave amplitude cannot be explained unless the P-wave velocity exceeds 8 km/s corresponding to the velocity in the mantle. It is unlikely that such material exists on the surface layer of the subducting plate. On the other hand, if the velocity becomes slower across the plate interface, it is explained by the presence of material with a P-wave velocity of about 2 km/s and a thickness of about 400 m. Therefore, it is considered that seismic activity is not observed due to abundant fluid at the plate interface that produces strong reflectivity.