Change in seismicity beneath the Tokyo Metropolitan area due to the 2011 Tohoku Earthquake
- Note1: This is a tentative result of the study in transition of seismicity (approx. M2 to M4) beneath the Tokyo Metropolitan area
- Note2: This is not to predict any massive earthquake activity (more than M6).
- Note3: This method is not applicable for the areas with no evident seismic activity.
This study is associated with the prepublication paper below:
Ishibe, T., K. Shimazaki, K. Satake, and H. Tsuruoka, “Change in seismicity beneath the Tokyo Metropolitan area due to the 2011 off the Pacific Coast of Tohoku Earthquake”, submitted to Special Issue of Earth, Planets and Space (EPS) “First Results of the 2011 Off the Pacific Coast of Tohoku Earthquake”
(Dr. Ishibe, Dr. Shimazaki, Dr. Satake and Dr. Tsuruoka)
Motivation of this study
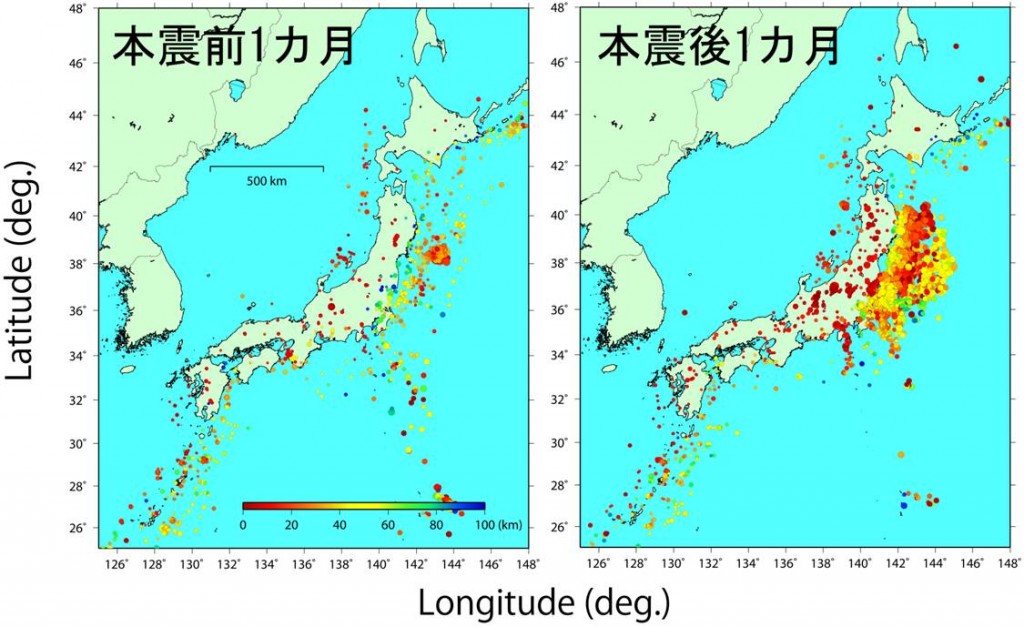
Since after the 2011 Tohoku Earthquake, an obvious changes in seismic activity is observed all over Japan. Left figure below is the seismic activity one month before the event, and the right figure below is the seismic activity one month after the event. Seismic activity in the inland of east Japan was also activated, other than the aftershock activity near the focal region.
We will determine if this change in seismic activity can be explained by Coulomb Failure Function(dCFF)or not.
What is dCFF?
Earthquake occurrence will change the stress distribution in the surrounding regions. And due this change in stress distribution, a new earthquake may be caused.
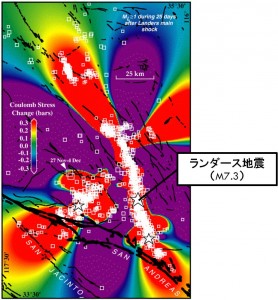 The left figure shows the changes in CFF of Landers earthquake (M7.3)
occurred in California 1992, with the gradation of purple to red (King et al., 1994). Purple is the area where stress has decreased and the possibility of earthquake occurrence has supressed, and the red area is where stress increased and the possibility of earthquake raised.
The white boxes in the figure indicate hypocenters. The seismic activity is concentrating on the red area. Therefore, there is an indication of activation in seismic activity where dCFF increased.
How much stress change was caused in the Tokyo metropolitan by the affect of 2011 Tohoku Earthquake? Before we continue discussing, here I indicated the problems about existing estimation methods of dCFF.
The method: Considering the mechanisms of earthquakes that occur after the main shock.
So far, when calculating the coulomb stress change (dCFF), we were assuming that the mechanism of each earthquake after the main shock was same as that of the main shock.
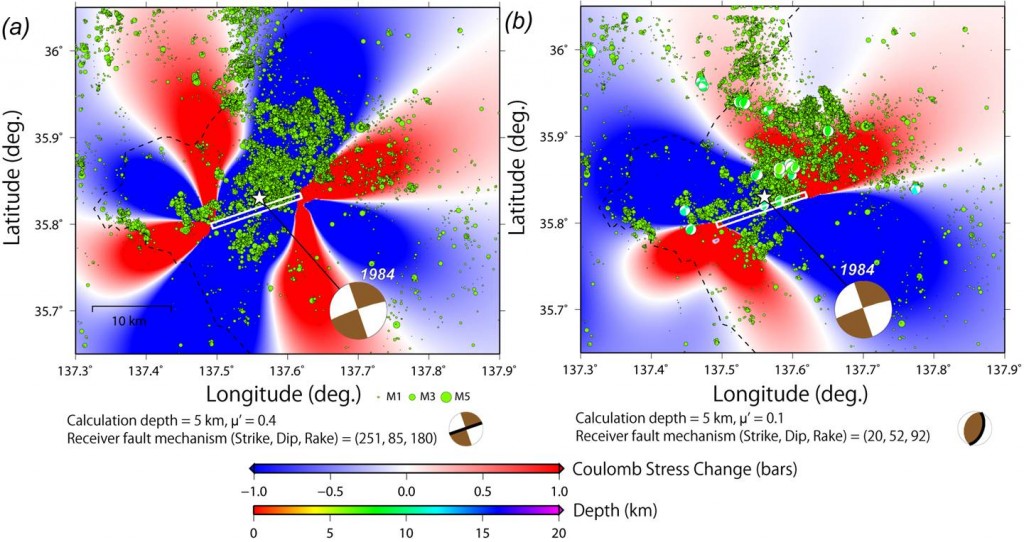
The figure below shows the CCF of West Nagano Earthquake (M6.8). Blue is where CFF decreased, and red is where increased. The yellowish green circle is the earthquake distribution after the main shock. The left figure is the case assuming a right-lateral fault as a hypocenter of the main shock, and the right figure is assuming the reverse fault.
By comparing these two, for the earthquake distribution after the main shock, it is better explained by the case of main shock assumed as a reverse fault, despite the fact that the main shock was right lateral fault. In fact, most of the earthquakes occurred after the main shock was reverse fault type.
In the complex tectonics environment like this, the analysis with mechanisms same as main shock may cause a huge error. Therefore, in this study, coulomb stress change was calculated using a catalogue of the past focal mechanisms (types of fault).
Focal mechanisms from first motion data of the Kanto-Tokai Observation Network
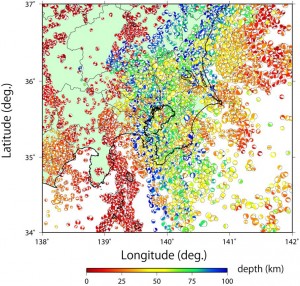 The left figure indicates the focal mechanisms from fist motion data above M2 with depth less than 100km occurred in between 1st July 1979 to 1st July 2003.
Coulomb stress change is calculated by using this 30000 earthquake mechanisms.
Calculated coulomb stress change
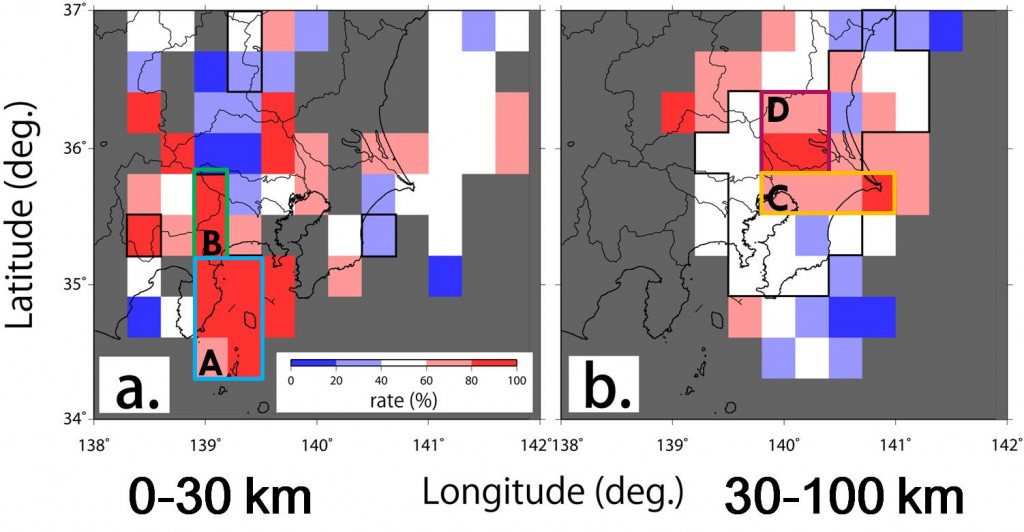
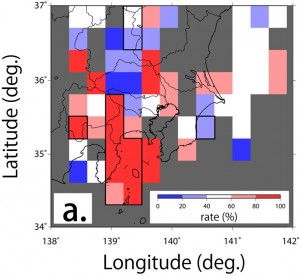
Calculated Coulomb stress change is shown in the figure below. Left is depth:0-30km, Right is depth: 30-100km of coulomb stress change. The red indicates the increase of CFF and the blue is decrease in CFF. And the gray part is where this method cannot be applied. In the region focal mechanisms were not available because the past seismic activity is too less.
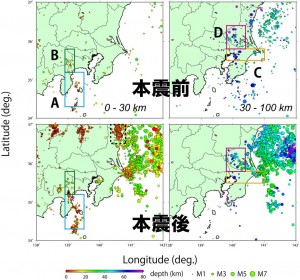
If this result is explaining the reality, microseismic activity is supposed to be activated in the red area. Below figure is the comparison of seismic activity data before and after the event. The above figure is the seismic activity before the main shock, the below figure is the seismic activity after the main shock. Left and right indicates the difference in depth (left: 0-30km, right: 30-100km)
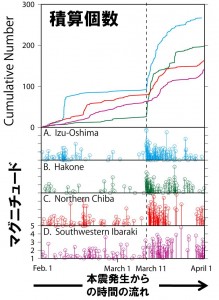
In the area A to D squared, it is visible that the seismic activity is slightly increasing after the main shock. By making a graph of the cumulative number and magnitude of the earthquakes in this area, according to the time, a left figure is completed.
Above the left figure, on the horizontal axis is the time since 1st February 2011, on vertical axis, the number of earthquakes after main shock is counted and plotted (note that it is a cumulative number). The color of the lines indicate the area of A to D. The number of earthquake is increasing after the main shock in 11th of March.
Below left figure indicates frequency and size of earthquakes in each of the areas from A-D. The horizontal axis is time since 1st February 2011, and vertical axis is the magnitude of the earthquake. Tendency of activation in seismic activity after the main shock in 11th March can be seen. However, the decrease of seismic activity in the end of March could be not true due to the incompletion of the the JMA hypocenter catalogue.
About the seismic activities in northern Ibaraki: examples of areas where this method cannot be applied.
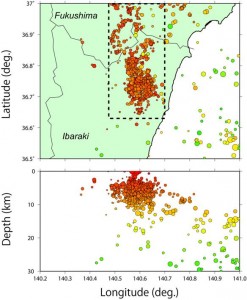
As seen on the left figure, seismic activity in the northern Ibaraki was activated after the main shock. Above left figure shows the plan view of the seismic activity, below left figure is the cross section from East to West.
By seeing the CCF of this area, it is in gray as shown by the yellow box in the right figure. As written above, gray is the area where this method cannot be applied. This is because the focal mechanism was not available due to lack of the past seismic activity.
This is the same for all areas in gray.

