
Launched: March 12th, 2011
Last updated: January 25th, 2012
At 14:46 (Japan Time) March 11th 2011, a massive scale earthquake of magnitude 9.0 occurred on the pacific coast along from Sanriku to Ibaraki coast.
We would suggest to call this ”2011 Tohoku earthquake” in short like the 1923 Kanto earthquake, since the official JMA name “The 2011 off the Pacific coast of Tohoku Earthquake” is too long.
Updates
- Seismic activity changes in capital region since 3.11(25th January 2012)
- Massive earthquakes in the world(updated 11th October)
- Trench survey on the surface earthquake fault of the 11th April 2011 earthquake in Hamadoori Fukushima pref.(QE)(9th September)
- Source process inversion updated (5th August)
- Tsunami Investigation of Sanriku from July 21st to 26th (2nd August)
- Details are added to Sea-level change recorded by the Ocean floor cable seismometer(20th July)
- Seismic map of historical aftershocks and induced earthquakes is added on Aftershocks of the past massive earthquakes (12th May)
- Tsunami Investigation of Southern Sanriku(10th May)
- Tsunami Investigation of Northern Sanriku(6th May/latest data updated on 10th)
- Change in seismicity beneath the Tokyo Metropolitan area due to the 2011 Tohoku Earthquake (26th April 2011)
- The surface earthquake fault of the 11th April 2011 earthquake in Hamadoori Fukushima pref. Report No.2 (20th April)
- Tsunami height of Kitasanriku – comparison with the tsunami in Meiji period and Showa period (18thApril)
- Tsunami height of Kitasanriku(18th April)
- The surface earthquake fault of the 11th April 2011 earthquake in Hamadoori Fukushima pref. (13th April)
- Aftershocks of the past massive earthquakes (12th April)
- 7th April 2011 intraslab earthquake off Miyagi prefecture (11th April)
- Tsunami investigation at Miyako, Iwaizumi, Tanohata, Fudai, Noda. (Temporary)(11th April)
- Tsunami run-up height in Tarou koboriuchi fishing port of Miyako city(11th April)
- The rupture process of the earthquake, found directly on the distribution of the seismic ground motion(29th March)
- Sea-level change recorded by the Ocean floor cable seismometer(28th March)
- A real-time waveform recorded by MeSO-net(28th March)
- Massive earthquakes in the world(Image updated 28th March)
- High rate GPS waveform(24th March)
- Comparison with the Great Chilean earthquake tsunami in 1960 and 2010 is added to Tsunami height in Ibaraki and Chiba coasts (24th March)
- Seismic wave propagation with periods of 20-50 second and 50-100 second(23rd March)
- Information and data handed out in the 892nd DANWAKAI added(23rd March)
- Tsunami height in Ibaraki and Chiba coasts (23rd march)
- Tsunami Magnitude Mt(K.Abe,1979)―The earthquake magnitude from the tsunami point of view(23rd March)
- Information and data handed out in the 892nd DANWAKAI<some of them are only in Japanese> (22nd March)
- FAQ updated(1 to 3 added) (17th March)
- Seismic wave propagation recorded on K-NET (17th March)
- Velocity waveform and response spectrum(17th March)
- Attenuation relation of seismic ground motion (Updated version)(16th March)
- Seismic wave propagation recorded on Hi-net(16th March)
- NIED Hi-net envelope waveform monitor(15th March)
- NIED F-net waveform monitor (15th March)
- Seismic activity off the Pacific coast of Tohoku (15th March)
- Distribution of the aftershocks occurred till 20:00 13th March(15th March)
- Massive earthquakes in the world(Image updated 15th March)
- Inverse refraction diagram of Tsunami(14th March)
- Source process inversion(14th March)
- Waveform by Hinet & F-net of NIED(14th March)
- Hagiwara-seismograph recording the earthquake in Nagano(13th March)
- Tsunami Simulation(13th March)
- Basic Information
- Pictures of tsunami
- Focal Mechanism derived by W-phase and P-wave
- Attenuation relation of seismic ground motion
- The waveform recorded at Earthquake Research Institute
- The comparison of long-period ground motion
- Strong motion seismogram recorded by ERI and AIST
- Seismic waveform recorded by the Observation Network for Earthquake Disaster in Tokyo Metropolitan Area
- After shock distribution and the hypocenter of the main shock
- Link
- Location of hypocenter: 142.86N,38.10E,23.7km depth
- Magnitude: Mw 8.8
- Type of earthquake: interplate earthquake
- Related plates: the Pacific plate, the North American plate
- Type of focal mechanism: low-angle reverse fault (almost East-West compressional axis)
- The height of observed tsunami: above 7 m in Soma, above 4.2 in Oarai
Frequently asked questions
1.On 12th March, there was an earthquake in Nagano, and on 15th there was one in Eastern part of Shizuoka. Are these earthquakes related to the 2011 Tohoku earthquake occurred on 11th?
- It could be relevant. The 2011 Tohoku earthquake was a massive earthquake with magnitude 9. The plate which Japanese islands lie on, is also being affected by this earthquake, so it could be considered that seismicity in some areas will be activated. Please be ware of these earthquakes. (For your reference visit 10 Tips For Earthquake Safety and 10 Ways To Prepare for an Earthquake)
2.Will the earthquake in East Shizuoka give any affect to the Tokai earthquake?
- The East Shizuoka earthquake on 15th March occurred near Fujinomiya city. Between this area and Suruga Bay, there is an active fault called Huzikawa koko Fault Zone. The relevance of this active fault and the expected Tokai earthquake is pointed out. However, further consideration is needed to identify if this earthquake may directly trigger the Tokai earthquake. The further consideration concerning this was made in the meeting held on 16th evening by The headquarters for Earthquake research Promotion. And it was announced that “an anomalous crustal change that may directly cause the expected Tokai earthquake was not observed
3.Is it true that the volcanoes in Tohoku and Kanto are becoming active?
- It is true. Just after a huge earthquake, it is usual for the surrounding volcanoes to become active for a while. So far, these volcanoes are coming to its end, but monitoring will be still continued.
4.What was the expected Off-Shore Miyagi Prefecture earthquake like?
- A huge earthquake that repeatedly occurs off-shore of Miyagi Prefecture, slightly toward the land. The magnitude is approximately 7.5, and is considered that the recurrence interval is 30 years. The recent one occurred 12th June 1978 with magnitude of 7.4. Death toll: 28.
5. Is this earthquake the Off-Shore Miyagi Prefecture earthquake?
- Because it is very different from the expected magnitude, this is not just Off-Shore Miyagi Prefecture earthquake, but also including Off-Shore Fukushima prefecture, Off-Shore Ibaraki prefecture and Off-Shore Iwate prefecture in the focal area.
- It is known from the research of tsunami deposit from this area, that there was a huge earthquake called Jogan Sanriku Earthquake in 869.
6.What kind of earthquake was expected in the region off the Pacific coast of Tohoku?
- The long-term estimation according to the Headquarters for Earthquake Research Promotion is as follows:
- It is known that huge earthquakes have been repeatedly occurring, with focal area from off-shore Miyagi prefecture to Japan Trench. Also, in this region, it is known that there is an earthquake that occurs, having both close-land and close-Japan Trench as a focal area respectively.
- It is considered that the off-shore Miyagi prefecture earthquake is occurring on the plate boundary toward east from the coast of Oshika Peninsula with the Pacific Plate subduction in tohoku region.
- The Headquarters for Earthquake Research Promotion Website: http://www.jishin.go.jp/main/chousa/00nov4/miyagi.htm
- If this earthquake was of the close-land or of the close- Japan Trench will be revealed by the further investigation.
7. A massive Tsunami was observed. Is this normal for this size of the earthquake?
- A crustal deformation is estimated to be in the scale of more than several meters at the bottom of the ocean, which caused a huge tsunami. Tsunami occurred in a vast area for hundreds of kilometers from off-shore Iwate Prefecture to coast of Ibaraki Prefecture.
8. Are there any examples of 8.8 magnitude earthquakes in the past?
- No earthquake in such scale occurred before in Japan. If Nankai earthquake is coupled with Tonankai Earthquake, magnitude 8.5 was expected. In any case, this earthquake is a maximum scale among the possible earthquakes that could happen around Japan.
Tsunami Investigation of Sanriku from 21st July to 26th

Blue= 1896 Meiji-Sanriku earthquake
Light green= 1933 Sanriku earthquake
Dark green= 1960 Great Chilean Earthquake
Blue-gray= 2010 Chile earthquake
Red= 2011 Tohoku Earthquake
(By Tsuji)
Tsunami Investigation of Southern Sanriku
The measured result in Southern Sanriku.
(By:Tsuji)

Tsunami Investigation of Northern Sanriku
The measured results of: Otobeno-Numanohama, port Kashinai, Chikei of Omoe peninsula, Aneyoshi, port Omoe, Ymadamachi-Koyadori and Ryouri-Sanrikucho, Oofunato city.
(BY: Yoshinobu Tsuji (ERI), Prof. B.H.Choi(SKKU),Dr.Kyeong Ok Kim (KORDI), Mr Hyun Woo Kim(Marine Info Tech Co))


Change in seismicity beneath the Tokyo Metropolitan area due to the 2011 Tohoku Earthquake

(Dr. Ishibe, Dr. Shimazaki, Dr. Satake and Dr. Tsuruoka)
Tsunami height of Kitasanriku – comparison with the tsunami in Meiji period and Showa period
(By:Dr.Tsuji)

Tsunami height of Kitasanriku (from Miyako to Nodamura)
(By:Dr.Tsuji, Dr.Satake, Project Researcher.Ishibe, Project Researcher.Nishiyama)

Preliminary report on trench excavation across the coseismic surface rupture associated with the 2011 Fukushima Prefecture Hamadori earthquake (M7.0)
(7th September)
A month after March 11 gigantic Tohoku earthquake (M9.0), M7.0 earthquake occurred at a depth of 5 km on April 11 beneath coastal area of Fukushima prefecture (JMA, 2011). Focal mechanism of the mainshock indicates that this earthquake is a normal faulting event beneath the Abukuma Mountains. Based on field reconnaissance, about 11-km-long coseismic surface ruptures were recognized along the Shionohira fault mapped prior to this event and are interpreted as a surface manifestations of its reactivation associated with normal faulting event (c.f., Ishiyama et al., 2011; Sugito et al, 2011). This strongest in-land earthquake event occurred after the Tohoku earthquake may imply its mechanical relation to the gigantic megathrust earthquakes. In this report we introduce preliminary results of a trenching survey across the coseismic surface ruptures at Shionohira site, conducted from 29 July to 25 August, to resolve timing of paleoseismic events along the Shionohira fault. Click here to read more

Image1: View of drilling in Shionohira trench
By: Tatsuya Ishiyama (ERI), Nobuhiko Sugito (Research Center for Seismology, Volcanology and Disaster Mitigation, University of Nagoya), Tomoo Echigo (Geo-Research Institute), Hiroshi Sato (ERI)
The surface earthquake fault of the 11th April 2011 earthquake in Hamadoori Fukushima pref.
Second Report (20th April): 11th to 13th April Field survey Report
M7.0 (temporary) earthquake with depth 5km occurred around 16:00 11th Aprill at Hamadoori Fukushima prefecture (JMA2011). The surface earthquake fault was found along the active fault, known as Idozawa Fault, by the field survey done from the day after earthquake occurrence (12th to 14th).
Click here to see the second report concerning addition and changes from the first report provided on 13th. Or click the image below.

Image1: Loc 7. Tsumiki Toono Iwaki city. The surface earthquake fault running across the paddy field on the bottom of the valley. Facing north-northwest. Aperture rift evolves over the top of the cliff surface. The hinge indicated by cliff line of the bending and the aperture rift extends from city road in front to the slope in the back with right echelon formation. The road surface cliff height In front is 50 cm. The amount of horizontal extension measured from the off-set of channel is 6 cm.
(By: Tatsuya Ishiyama, Hiroshi Sato (ERI), Tanio Ito (univ. Teikyo Heisei), Nobuhiko Sugito (Research Center for Seismology, Volcanology and Disaster Mitigation), Tomoo Echigo (Geo-Research Institute), Naoko Kato (ERI),Toshifumi Imaizumi (univ. Tohoku)
Initial Report (13th April)
M7.0 (temporary) earthquake with depth 5km occurred around 16:00 11th Aprill at Hamadoori Fukushima prefecture. The surface earthquake fault was found along the active fault, known as Idozawa Fault, by the field survey done from the day after earthquake occurrence (12th).
Click here or image below to see detail
Loc1. Tabibito Tabito-cho Iwaki city The surface earthquake fault running across the paddy field on the bottom of the valley. Facing south. Aperture rift evolve over the top of the cliff surface. Cliff height is 80cm
(By: Tatsuya Ishiyama, Hiroshi Sato, Naoko Kato (ERI), Kouji Yagi (univ.Yamagata), Toyohiko Miyagi (univ. Tohoku Gakuin), Toshifumi Imaizumi (univ. Tohoku))
Aftershocks of the past massive earthquakes
Aftershocks will always occur after a huge earthquake. Attention to the aftershocks has to be paid in a long-term for this earthquake with magnitude of 9. Therefore, as a reference, below is the summary of the magnitude of aftershocks and the occurrence time of examples from off Sumatra earthquake in 2004, 2010 Chile earthquake and 1960 great Chilean earthquake. Additionally, the example of historical earthquakes within Japan is also given.
Click here or the below image to read in detail.
(By: Dr.Oki, Dr.Tsuji, Dr. Nishida)
For details on outer rise earthquake, visit the website: Hokkaido University Institute of Seismology and Volcanology.
")
7th April 2011 intraslab earthquake off Miyagi prefecture
Around 23:32 7th April 2011, a magnitude 7.4 earthquake occurred off Miyagi prefecture (latitude 38.2°N, longitude 142.0°E, depth 40km. The latitude, longitude, depth and magnitude are according to the Japan Meteorological Agency). Following is the focal mechanism derived from W-phase data recorded worldwide, using Kanamori and Rivera (2008) method.
The location of hypocenter obtained by grid searching is depth 49km, 38.2°N, 141.8 °E). Reverse fault with strong non-double couple component. The depth of hypocenter is suggesting that the earthquake was an intraslab earthquake.
(By:Dr.Yokota)


Tsunami investigation at Miyako, Iwaizumi, Tanohata, Fudai, Noda. (Temporary)
On 3rd and 4th of April, tsunami investigation was held from Miyako city to Kuji city. At Aonotaki, a Tsunami run-up height of 34.8 was measured, comparable to 37.9 at Koboriuchi Fisheries Cooperative Association. The black dots on the map below indicate for surveying points and the white dots are for inspection points. The numbers on bracket by the inspection points are an approximate height, so the result of further investigation is effective.
To see in detail click here or click the images below
(Dr.Tsuji, Dr.Oki, Project Researcher.Sugimoto, Researcher.Tomari)

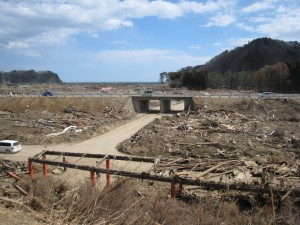
Facing the ocean from Tarou station (Tsunami run-up height11.7)
Tsunami run-up height in Tarou koboriuchi fishing port of Miyako city
By the leveling in the afternoon of April 3rd, it is assumed that the tsunami run-up height was up to 37.9m at Koboriuchi fishing port. The run-up height is comparable to the one of 38.2 m recorded at Ryouri of Ofunato city in Iwate when Meiji-Sanriku earthquake (1986).
(Dr.Tsuji, Dr.Oki, Project Researcher. Sugimoto, Researcher. Tomari)
The images are the view around the above mentioned point from the coast. 2 floats hanging on the right side of the pine tree in the middle is visible by clicking the image and enlarging. Likewise, black, white and orange float is hanging on its left which indicate that tsunami came up to this height.

The image below is fire-extinguishing vehicle that was parked around this area, broken by tsunami. 9 people are dead in this area including the fire fighters.

The rupture process of the earthquake, found directly on the distribution of the seismic ground motion
By replacing strong-motion seismograph (acceleration) record of NIED K-NET and KiK-net from south to north, it is possible to see directly and in detail, the rupture process of the fault lying 500 km from this earthquake.
The first massive rupture occurred at off Miyagi, and strong seismic wave was released all over Tohoku (the purple line in figure). After several tens of seconds, another massive rupture occurred and a strong seismic wave was released (light blue). Further the distance from the rupture starting point, the arrival time of the seismic wave will be delayed. But for the second rupture (light blue), time lag caused by the distance is short. This indicates that this second rupture occurred at the offshore far away from the land.
Then immediately, the third rupture occurred at the offshore near land of the northern Ibaraki (red), and strong seismic waves were radiated toward Ibaraki pref. and Tochigi pref.
The rupture property and the radiation characteristic of the third event have been different from the others because the release of the third event is not as clear as the acceleration record on the displacement waveform record.
(By:Dr.Noguchi and Dr.Furumura)


Sea-level change recorded by the Ocean floor cable seismometer
Sea-level change recorded by the Ocean floor cable seismometer off Kamaishi.
The ocean-bottom pressure gauge is set in depth of 1600m, around 76km away from land on ocean trench side (TM1). The other one on the land side is set in depth of 1000m, around 47km away from land (TN2).
![]()
Fig: 1 Location of the ocean bottom pressure gauge
Fig: 2 The observation record of the ocean bottom pressure gauge. At around 14:46, the ground motion of the earthquake (M9) reaches the pressure gauge and at TM1 (coast-side), the sea level is gradually rising from that point. The sea level rose 2 m, and after 11 minutes, the level went drastically up to 3m, which makes 5 m of elevation in total. At TM2: located 30km toward the land, a same elevation of sea level was recorded with 4 minutes delay from TM1.
A real-time waveform recorded by MeSO-net
The seismic waveform data from the 3 observation stations: Museum of History and Folklore (Ibaraki pref.), Matsudo Mabashi High School (Chiba pref.), Earthquake Research Institute (Tokyo) among the seismic observation data recorded by the high-density seismograph network (MeSO-net)
Click to see real-time waveform recorded by MeSO-net


Figure1: Station distribution of GEONET

Figure2:GPS waveform of 20 minutes including the origin time
The result of kinematic analysis of 1 second-sampling data sample data of GEONET,that shows a real-time crustal deformation by the earthquake.
A small displacement before the huge displacement is observed at stations in Miyagi and Iwate near the starting point of rupture. (Fixed point: 960645 Kasumi/Hyougo)
(By:Dr.Yokota)
- Analysis software: GIPSY-OASIS
- Almanac: JPL Rapid
- Method of analysis: Kinematic positioning analysis every second.
Acknowledgement : This was achieved using the GEONET data of Geographical Survey Institute.
Seismic wave propagation with periods of 20-50 second and 50-100 second
A visualized seismic wave propagation with periods of 20-50 second and 50-100 seconds, using the data recorded on NIED Kyoshin Network (K-NET) and Kiban Kyoshin Network (KiK-net). The amplitude of vertical component (acceleration) is shown by indicating the upward in red and downward in blue. The “+” marks on the map show where the observation stations used for analysis. Just after the earthquake occurrence, seismic wave propagated radially outward with the center at the hypocenter (marked with ★), but the circular shape was distorted gradually because the seismic wave was radiated persistently along the fault plane of about 500 km.
(By: Dr.Furumura and Project Researcher. Maeda)
Credit: “Earthquake Research Institute, University of Tokyo, Dr.Furumura and Project Researcher. Maeda”
*Above credit must be clearly mentioned for any secondary use.
Click each of the figures to see the animation


Tsunami height in Ibaraki and Chiba coasts
Data of the tsunami height on the coasts of Chiba and Ibaraki, according to the research done on- site.
The unit of measurement is in m(metres).
(By: Tsuji et.al)
")
Comparison with the Great Chilean earthquake tsunami in 1960 and 2010

Tsunami Magnitude Mt(K.Abe,1979)―The earthquake magnitude from the tsunami point of view.
(ERI Emeritus Professor: Katsumasa Abe)
The tsunami magnitude Mt of the Tohoku earthquake is calculated by using each of the tsunami height in the locations below.
- A formula is Mt = log H + 9.1 + deltaC
(Ref. Abe, K., J. Geophys. Res., 84, 1561-1568, 1979)
- Mt: Tsunami magnitude
- H: Maximum amplitude on tide gage record in meter
- deltaC: station-source correction
| H(m) | deltaC | Mt | |
| Honolulu | 0.7 | 0.0 | 9.0 |
| Hilo | 1.4 | -0.4 | 8.9 |
| Aleutians (3) | 1.2 | -0.2 | 9.0 |
| California (4) | 1.4 | 0.1 | 9.4 |
The tsunami magnitude Mt=9.1 of this earthquake was obtained by figuring up the average from above. This value is the same with Mw=9.1 which was derived from seismic observation. Therefore, this indicates that this earthquake wasn’t a tsunamigenic earthquake (an earthquake that has bigger tsunami than the ground motion).
Below are the earthquakes which had tsunami magnitude of above Mt=9.0:
- 1837 Valdivia, Chile 9.3
- 1841 Kamchatka 9.0
- 1868 Arica, Chile 9.0
- 1877 Iquique, Chile 9.0
- 1946 Aleutians 9.3
- 1952 Kamchatka 9.0
- 1957 Aleutians 9.0
- 1960 Chile 9.4
- 1964 Alaska 9.1
- 2004 Sumatra, Indonesia 9.0
Information and data handed out in the 892nd DANWAKAI (ERI Monthly meeting)Click here to see all the information handed out at 892nd DANWAKAI[Some of them are only in Japanese]
Seismic wave propagation recorded on dense strong-motion seismograph networks in Japan (K-NET/KiK-net)Credit: “Earthquake Research Institute, University of Tokyo”*Above credit must be clearly mentioned for any secondary use.The animation of Seismic wave propagation recorded on K-NET/KiK-net
(By: Dr. Furumura Dr.Takemura Dr.Takemoto)
An visualized image of the seismic wave propagation of the 2011 Tohoku earthquake, using the data recorded at 1800 stations of dense strong-motion seismograph networks in Japan (K-NET/KiK-net). The intensity of ground motion is indicated visually with darkness of orange and its height. (After creating the image using the data of Seismic wave propagation recorded on High-Sensitivity seismograph network(Hi-net), the data of K-NET/KiK-net was released, so reanalysis was done using this)
Click to see the animation.
The strong ground motion due to the earthquake reached Oshika Peninsula in 35 sec from origin time, and in 40 sec Kesennuma to Sendai, in 50sec from Kamaishi to Iwaki and then propagated throughout the whole region of North-East Japan in 70 sec.


The shake propagated throughout the whole region of North-East Japan and Kanto. In a wide area between Hokkaido and Central Japan had strong ground motion lasted for minutes.


Maximum acceleration and maximum displacement of ground motion
A strong ground acceleration of over 2933 cm/s/s was observed in K-NET Tsukidate observation station (Miyagi pref.) near the hypocenter, and a strong ground acceleration propagated in broad area from Ibaraki to southern Iwate. The distribution of strong ground acceleration is extending to three areas: between Iwate and Miyagi prefecture, Fukushima pref., between Tochigi and Ibaraki pref. Therefore, it is assumed that a huge fault slip have occurred on the east of these areas. The ground acceleration is decaying drastically just after the border of Itoigawa-Shizuoka Tectonic Line, and it suggests that the wave attenuated at around this area.

According to the distribution of ground displacement, it is obvious that there was a major ground motion of maximum above 50cm from Tohoku to Kanto area. Especially in Sendai plain there was a huge ground displacement of more than 100cm.

Maximum acceleration and maximum displacement of ground motion in Ishinomaki and Rikuzentakata
Below figures show the maximum acceleration and maximum displacement of ground motion in Ishinomaki and Rikuzentakata where ground motion was strong. The arrival of 2 strong seismic wave groups is seen after about 50 seconds. They suggest that a strong seismic wave was radiated from the 2 major asperities of the Miyagi coast and Iwate coast.
Two long-period pulses (40-50 second) was found in ground displacement and its amplitude is more than 50 to 100cm. The long-period of ground motion that lasted for 100 and several tens of seconds, indicates the long time rupture process of the fault in this massive earthquake.

Above: Ishimaki below:Rikuzentakata
Velocity waveform and response spectrumThe velocity waveforms of strong ground motion recorded at the 3-NET stations (Tsukidate and Shiogama of Miyagi pref. and Hitachi in Ibaraki pref.) and their response spectra are compared with those at Takatori and fukiai in Kobe Earthquake (Great Hanshin earthquake).In this earthquake, the response with a period of 1 – 2 second that directly gives damage to the wooden buildings was small, and is less than 100 cm/s. This is less than the half of Takatori and fukiai point in Kobe Earthquake (200-300 cm/s).
(By:Dr. Furumura)


Attenuation relation of seismic ground motion (Updated version)
- The moment magnitude is Mw=9.0 according to W-phase mechanism.
- Shortest fault distance was estimated by referring to a fault model by ERI.
- The type of earthquake is interplate earthquake.
- Formula of attenuation of distance is applied to Mw9.0 extrapolating Si and Midorikawa(1999).
- The maximum acceleration and maximum velocity are bandpass filtered with 0.1~10Hz for data provided by NIED and ERI.
- Nilim and PAWI are the value listed on the data list of National Institute for Land and Infrastructure Management and Port and Air Port Research Institute.
- Most of the ERI observation stations are on the firm ground.
(By: Project researcher: Si, Assistant Professor: Miyake, and Professor: Kouketsu. Data provided by: NIED)

Seismic wave propagation recorded on High-Sensitivity seismograph network(Hi-net)Credit: “Earthquake Research Institute, University of Tokyo”
*Above credit must be clearly mentioned for any secondary use.
Animation of the seismic wave propagation recorded on(Hi-net)The maximum acceleration(PGA)of the earth surface was set up by using Hi-net observation data (Note that the seismograph near the focal region is saturated, and the value is not accurate). A strong acceleration of over 200 cm/s/s was observed in a broad area of 500km from the mid-Iwate to Ibaraki coast which is near the focal region.The ground acceleration is decaying drastically on the west side at the border of Itoigawa-Shizuoka Tectonic Line. It suggests that the wave attenuated at around this area. (Click the left image to see the animation)
(By: Dr.Furumura and Dr.Takemura)
An visualized image of the seismic wave propagation of the2011 Tohoku earthquake, using the data from 800 High-sensitivity seismograph network(Hi-net)located all over Japan. The intensity of ground motion is indicated visually with darkness of orange and its height.
The strong ground motion due to the earthquake reached Oshika Peninsula in 35 sec from origin time, and in 40 sec Kesennuma to Sendai, in 50sec from Kamaishi to Iwaki and then propageted throughout the whole region of North-East Japan in 70 sec.


The shake reached Nagoya and Sapporo after 150 sec, and by this time, data transmission from all around Tohoku area was lost. Therefore there are no data for Fukushima, Yamagata, Miyagi, Akita, Iwate Prefectures.
And then, the shake reached Wakkanai in 200 sec, further on to Ōsumi Peninsula in 300 sec, and then the whole Japanese archipelago were shaken for more than few minutes.


Usually, an animation of a seismic wave propagation is made using the strong motion waveform of K-NET, KiK-net, but this time, the data from NIED is not released because of the earthquake, so for now it is created using Hi-net. (It is reactivated at 19:00 on 13th)
Other than NIED, the data of Hi-net is delivered to ERI and JMA, via distinct line.
NIED Hi-net envelope waveform monitorThe below data shows the hourly plot of the envelope waveform recorded at the observation stations located around Eastern Japan along the Pacific coast, among the Hi-net High-Sensitivity seismograph network of NIED.The envelope is calculated RMS amplitudes of velocity seismograph (vertical component) in the frequency band from 2 to 16 Hz.
(Observation and Development Technology Center:Dr. Obara Kazushige)

NIED F-net waveform monitorThe below data shows the hourly plot of waveform recorded at the observation stations located around Eastern Japan along the Pacific coast, among the F-net Broadband Seismograph Network of NIED (National Research Institute for Earth Science and Disaster Prevention).The upper column shows the hourly plot of waveforms bandpass-filtered from 10 to 100 second. The column below shows calculated RMS amplitudes of Velocity-type strong motion seismograph (vertical component) in the frequency band from 2 to 16 Hz.
(Observation and Development Technology Center:Dr.Obara Kazushige)
Click the image below:

Seismic activity off the Pacific coast of TohokuClick the image below:
Distribution of the aftershocks occurred till 20:00 13th MarchAftershock Distribution indicated together with the assumed focal regions of the subduction zone earthquakes estimated by The Headquarters For Earthquake Research Promotion.
Waveform by Hinet & F-net of NIED (National Research Institute for Earth Science and Disaster Prevention)By collaborating with NIED, continuous waveforms images collected from some of the observation stations of Hi-net & F-net are created. Click the map for more detail.
(By: Observation and Development Technology Center/ Earthquake and Volcano Information Center)

An inversion of teleseismic body waves were performed using the method of Kikuchi et al. (2003). The figure below shows the slip distribution derived from the obtained source process model.

(By:Dr.Poiata, Dr.Miyake and prof.Koketsu)
Inverse refraction diagram of TsunamiInverse refraction diagram of Tsunami is an figure which tracks back the wavefront of tsunami from a given time till the origin time.The left figure: An inverse refraction diagram, from the first arrival time at stations both on shore and undersea. The blue wavefront corresponds to drow-down and the red wavefront does a run-up. Envelope of this wavefront is considered as a wave source of tsunami. The triangles on the map are the tsunami observation stations. The red ones are the observation station where run-up came as the first wave, the blue ones are where draw-down was the first wave, the purple ones are where run-up came after an imperceptible draw-down. It is assumed that the tsunami wave source was extending up to the ocean trench.The right figure: An inverse refraction diagram of the peak of first run-up wave recorded by a reliable undersea tsunami recorder. It is assumed that the most uplift area of this earthquake is located inside the pink circle where wavefront is gathering.


Hagiwara-seismograph recording the earthquake in northern Nagano at 03:59 March 12thA movie taken at Seismograph Museum of Earthquake Research Institute in Bunkyo-ku, Tokyo. Hagiwara-seismograph recording the magnitude 6.7 earthquake occurred in northern Nagano at 03:59 March 12th.
(Filmed by techinical staff: Atsushi Watanabe)

click the above image to see the movie
Tsunami simulation (prof.Satake) Credit: “Earthquake Research Institute, University of Tokyo, Prof. Takashi Furumura and Project Researcher Takuto Maeda”
*Above credit must be clearly mentioned for any secondary use.
You can download from here Tsunami simulation (prof. Furumura)
Credit: “Earthquake Research Institute, University of Tokyo, Prof. Takashi Furumura and Project Researcher Takuto Maeda”
*Above credit must be clearly mentioned for any secondary use.
You can download from here
The crustal change is calculated by referring to the source model of USGS, on the assumption of fault size 600km×250km and fault slip 17 m. The rise of seafloor surface causes tsunami and at the same time, sinking of the coastal regions nurtures the flooding from tsunami.
(Prof. Takashi Furumura and Project Researcher Takuto Maeda)
snapshots:

(after 5min) Tsunami extending slowly toward the land. A huge wave crest heading to the coast after a small drawback

(after30min) Tsunami surging in wide range from Hokkaido to Boso Peninsula

(after 1hour 10min) Tsunami reflected at the coast line focusing at Sendai bay

(after 2hours) Tsunami trapping along the coast and change in sea-level is lasting long
Pictures of tsunami
Click here to see all the pictures. Or click the image below.(Please inquire Asahi Shimbun for secondary use)
Taken by prof. Satake Kenji

Ofunato-shi
[Focal Mechanism derived by W-phase and P-wave ]Following is the focal mechanism derived by W-phase data recorded worldwide, using Kanamori and Rivera (2008) method. Below figures show the mechanism by Earthquake Reseach Institute, USGS, Global CMT (left to right). Low-angle reverse fault are achieved in all of them.The optimal location of the W-phase solution was estimated by grid search method. Probable location ranged in wide area along North-South direction. Parameters of best fit solution are as follows: slope:10,Half duration:70 s,depth 24 km, 38 degrees northern latitude,143 degrees eastern longitude(indicated with red star). Again note that a good waveform-fit was achieved in a wide range at North-South.
Attenuation relation of seismic ground motion (temporary)Shortest fault distance was estimated by referring to a fault model by USGS. The left figure shows the plot against shortest fault distance and maximum acceleration, and the right one shows the plot against shortest fault distance and maximum velocity. In the both figures the model by extrapolation of Si and Midorikawa(1999) is also shown. The moment magnitude is Mw=9.0 according to ERI’s W-phase mechanism. The type of earthquake is interpolate earthquake.All data are provided by ERI, except for DPRI. The maximum acceleration and maximum velocity are bandpass filtered with 0.1~10Hz.
The waveform recorded at Earthquake Research InstituteThis figure shows ground motion waveforms recorded at Earthquake Research Institute. After the major wave packet with the maximum amplitude of about 60 cm, a vibration of several cm lasted for more than 10minutes.
(By: Dr.Furumura and Dr.Takemura )
")
The comparison of long-period ground motion: The feature of seismic ground motion in city center and influence by architectural structure
Velocity response spectrum is calculated according to waveform recorded at Earthquake Research Institute in Bunkyou-ku district. The figure shows comparison with that of Niigata Chuetsu earthquake in 2004. The Chuetsu earthquake had strong long-period ground motion with period of 7 second, which causes only a minor damage mainly among skyscraper buildings. The 2011 Tohoku earthquake has about the same strength of velocity response occurred in a wide periodic band from 0.5 to 20 second. Not only skyscrapers but also all kind of buildings from wooden building (below 0.5 second) to a low-slung building (around 1second) and skyscraper buildings (few second).
(By:Dr.Furumura and Dr.Takemura)

Velocity waveform ERI
") Velocity response spectrum
Velocity response spectrum
")
Strong motion seismogram recorded by ERI and AISTAcceleration (above figure) and velocity waveform (below figure) observed at ERI.*For experts: ASCII data download
(By:Dr.Miyake, Dr.Furumura, Dr.Takemura)
")
")
Seismic waveform recorded by the Observation network for Earthquake Disaster in Tokyo Metropolitan Area
You can see the latest data from here


After shock distribution and the hypocenter of the main shock provided by Japan Meteorological Agency
After shock distribution, plotted according to the hypocenter announced by Japan Meteorological Agency.
(By: Dr.Nishida, Dr.Oki, Fukui)

Massive earthquakes in the worldMassive earthquakes since 1900 are plotted on the world seismicity map below. The yellow square is the fault plane and is shown corresponding to the size of the magnitude. (Click to enlarge)

- Japan Meteorological Agency
- USGS:Magnitude 8.9 – NEAR THE EAST COAST OF HONSHU, JAPAN
- The Headquaters for Earthquake Research Promotion
- International Institute of Seismology And Earthquake Engineering : The 2011 off the Pacific coast of Tohoku Earthquake on March 11, 2011
- Kyoto University Research Center for Earthquake Prediction DISASTER PREVENTION RESEARCH INSITUTE:The 2011 off the Pacific coast of Tohoku Earthquake
- Hokkaido University Institute of Seismology and Volcanology
- NIED 2011Tohoku Earthquake
- Japan Geoscience Union The 2011 off the Pacific coast of Tohoku Earthquak
- EEW: Earthquake Early Warning
- Disaster Emergency Message Dial 171
- To learn about how to prepare for earthquake, visit: Tokyo Fire Department