
Website Launched: 24th October, 2016
On 21st October 2016, 14:07 local time, Magnitude 6.6 earthquake (according to JMA) occurred in Tottori prefecture.
*All figures/pictures/movies should be credited as: “Earthquake Research Institute, The University of Tokyo” when cited.
(Strong Motion Seismology Group)
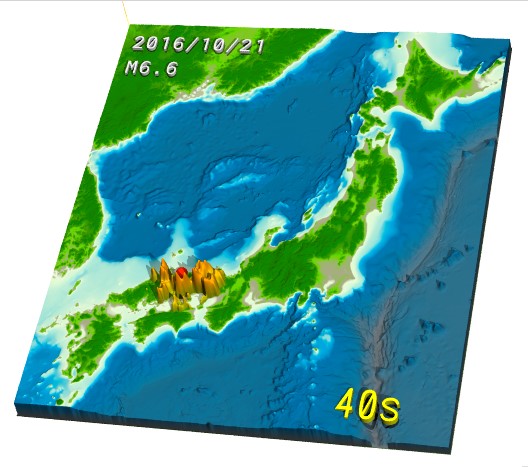
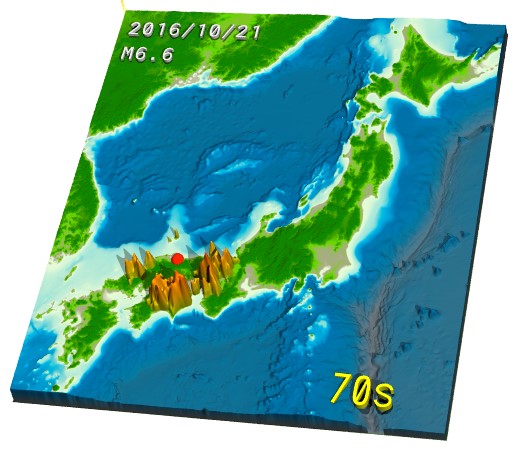
Fig.1 Seismic wave propagation recorded on dense strong-motion seismograph networks (K-NET and KiK-net, NIED). Visualized image of the seismic wave propagation 40s and 70s after the earthquake. The red indicate for the hypocenter, the spread of orange area indicate for the ground shaking spreading from the hypocenter.
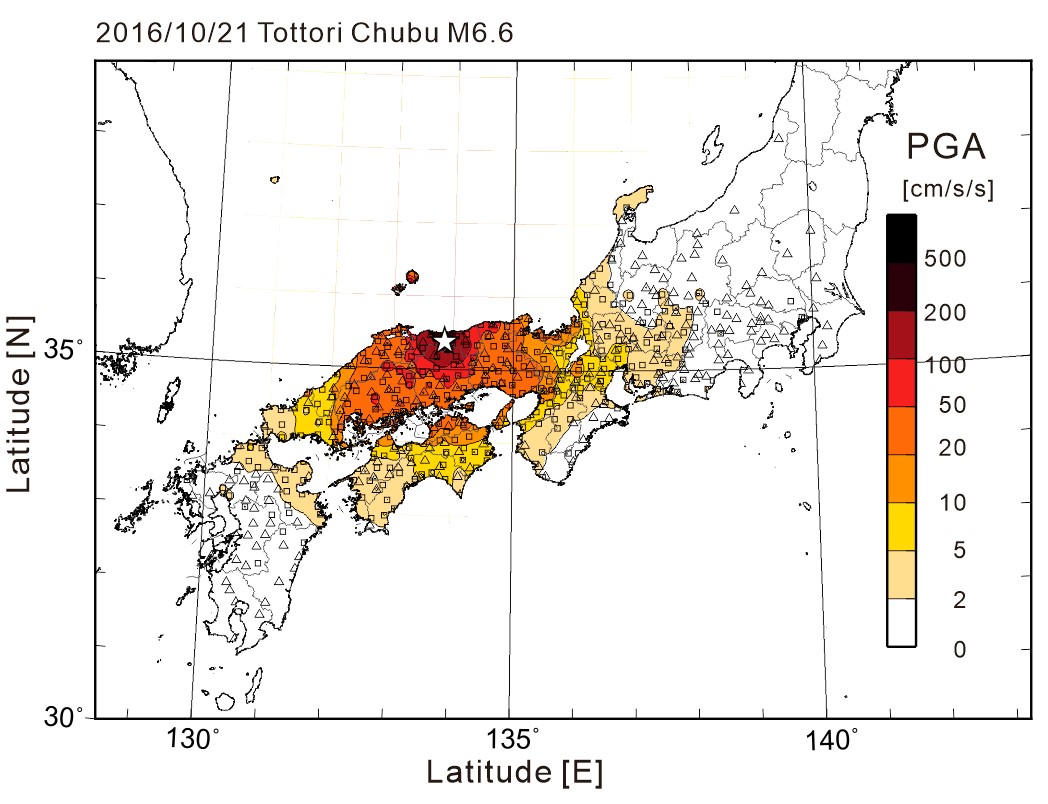
Fig.2 Distribution of the maximum ground acceleration (PGA; cm/s/s) due to earthquake, derived using the record from K-NET(marked □ in the map)and KiK-net(marked △)in NIED. Since this was a shallow earthquake occurred in depth h=10 km, a very strong ground acceleration (more than 1g) was recorded at the observational just above the source(star)area. However, the ground acceleration attenuates very rapidly as it takes distance from the hypocenter. The ground shaking was nearly imperceptible in Kyushu or Central Japan, over 400 km away from the hypocenter. The acceleration distribution seem to have extended toward east-west from the concentric circle probably due to source radiation properties of the strike-slip fault source.
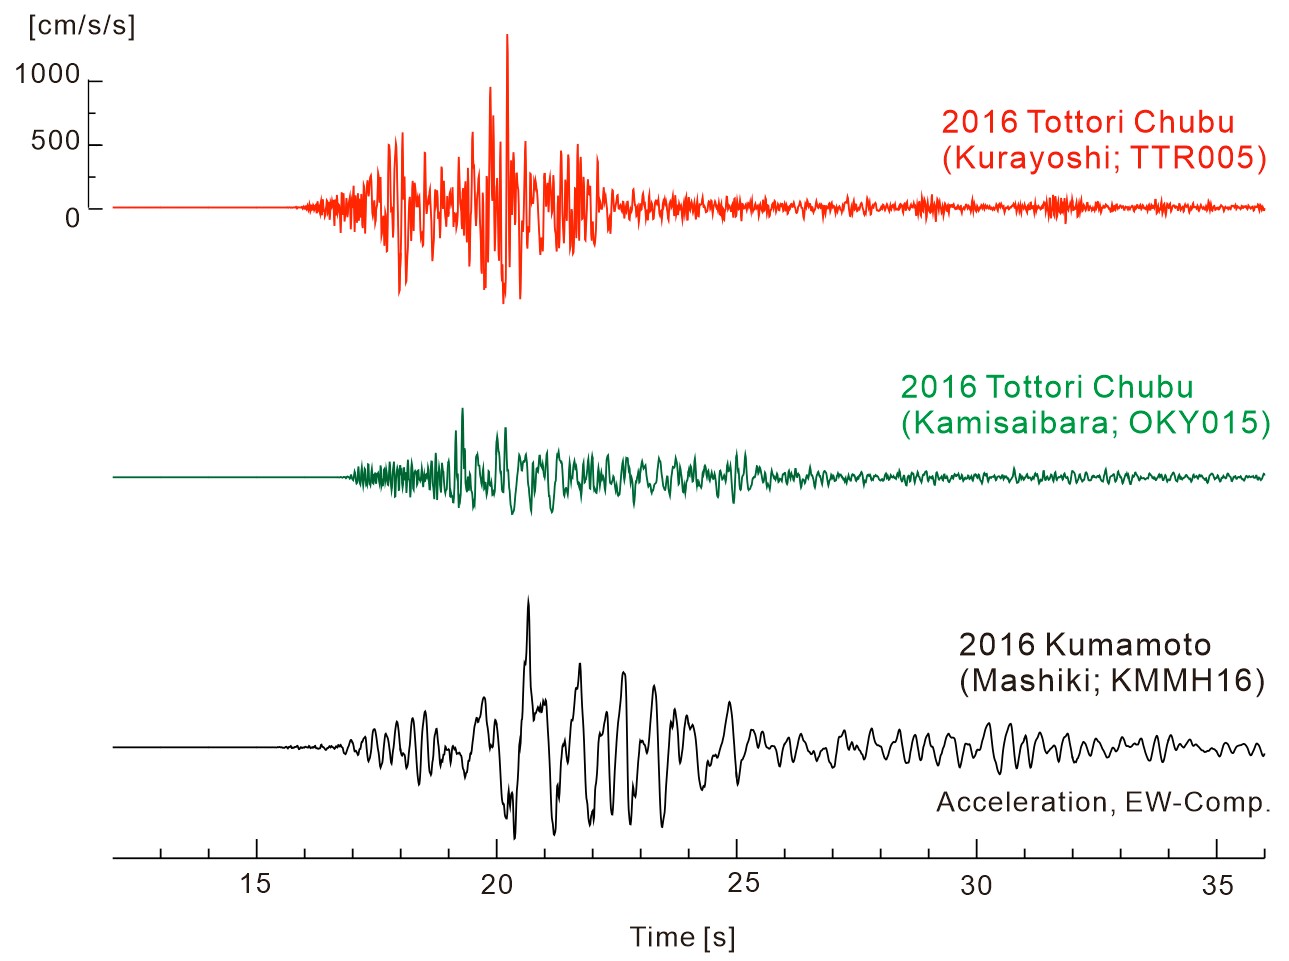
Fig. 3 Velocity waveform of EW-component ground motion recorded at the two observational points near the seismic source: KiK-net Kurayoshi (TTR005; red trace) and K-NET Kamisaibara (KY015; green trace), compared with waveform from 2016 Kumamoto (M7.3) earthquake recorded at KiK-net Mashiki(KMMH16). The duration of intense ground motion is rather short (10 sec) since the earthquake occurred just beneath these stations. The ultrashort-period motion of around 0.4second component is evident at Kurayoshi and Kamisaibara, which is contrast to a relatively long-period (about 1sec) ground motion observed at Mashiki by the time of Kumamoto earthquake.
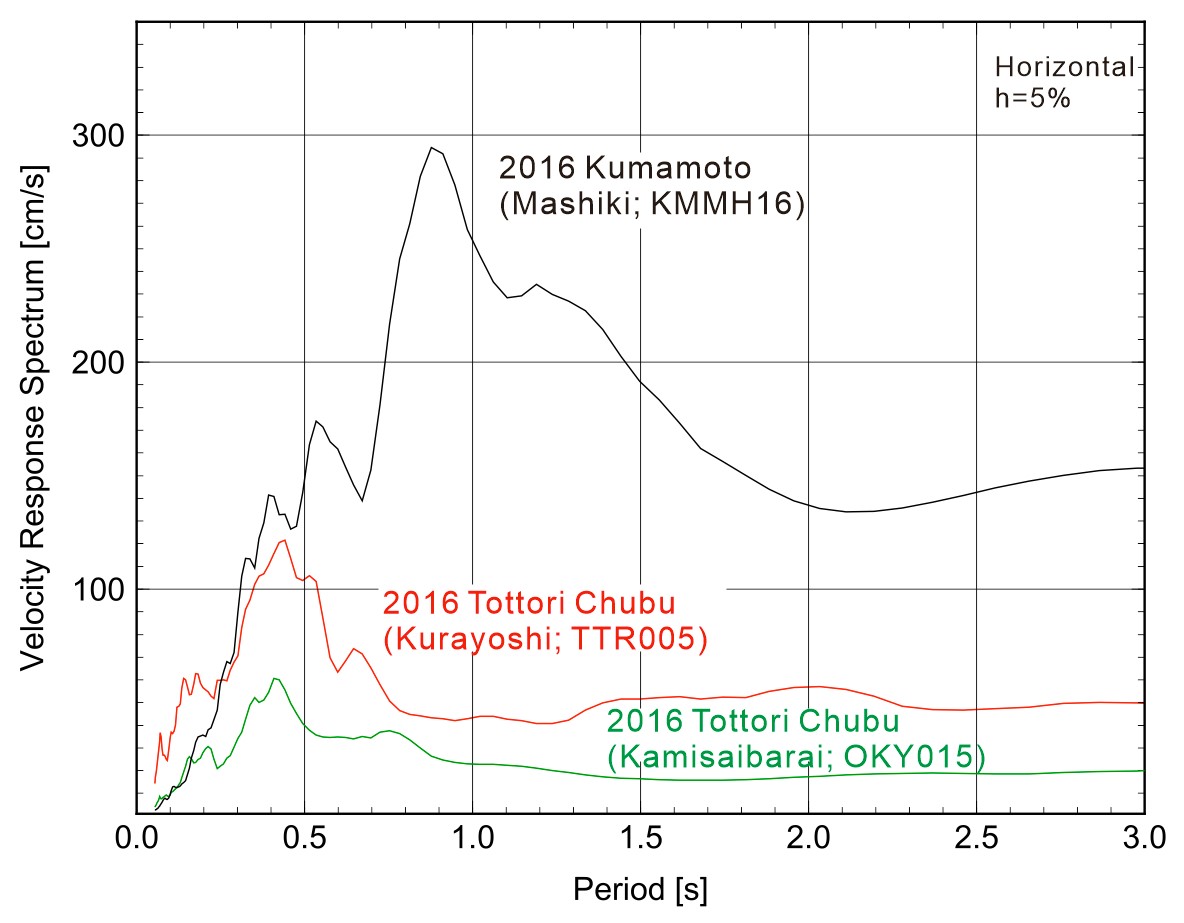
Fig4. Velocity response spectrum of the strong ground motions recorded Kurayoshi and Kamisaibara (red and green solid lines, respectively) to see the effect on buildings oscillation to have different natural period. In most of its periodic band, response spectrum of both point record are below the level of that recorded at Mashiki in Kumamoto earthquake. Whereas the periodic component of around 0.4 s was evident for the present Tottori earthquake. the periodic component of 1-2 s which causes major damage to wooden buildings were small (with velocity response spectrum less than 40 cm/s). Therefore, small structure and buildings such as grave stone may have damaged, but collapse of wooden building may be to a limited extent.
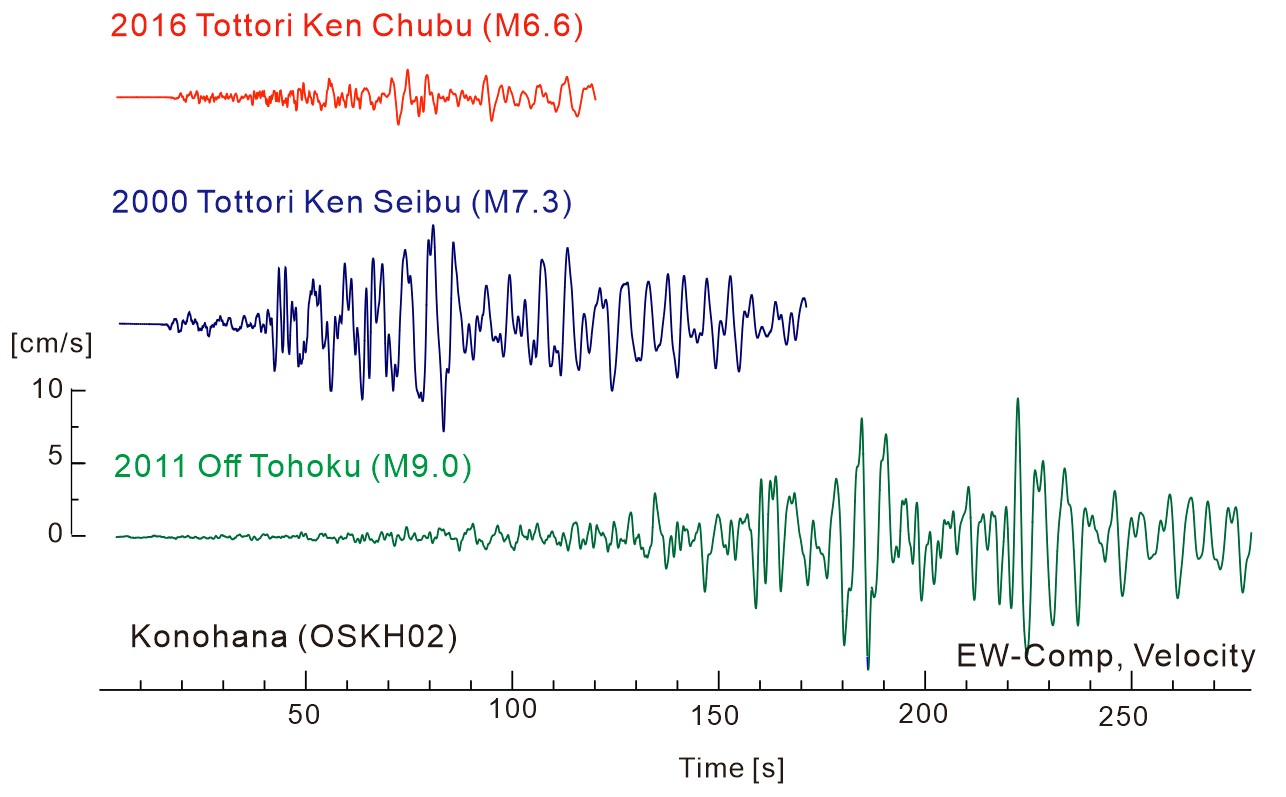
Fig.5 During the earthquake long-period ground motion was recorded in Osaka basin with Japan Meteorological Agency long-period ground motion seismic intensity scale of 2 (4 is maximum). The ground velocity motion (EW component) record on KiK-net Sakishima(OSKH02)is indicated in red trace. Compared with the 2000 Tottori Ken Seibu earthquake (M7.3; blue trace) and the ground motion of 2011 Tohoku earthquake (M9.0; green trace) at the same place, it is obvious that the amplitude of the observed long-period ground motion (surface wave) recorded at Osaka basin during the present M6.6 Tottori earthquake was small less than 1/5 of the former record.

Fig.6 Velocity response spectrum at Sakishima,Osaka(OSKH02), shows a peak velocity response of maximum 6 cm/s at the period of 5 s. In contrary, larger scale earthquake like 2011 Tohoku earthquake (M9.0) and 2000 Tottori Seibu earthquake (M7.3), velocity response spectrum was severalfold bigger, and was expanding upto longer periodic band due to increase in source spectrum to lower-frequency band with increasing source magnitude.
(Prof. Takashi Furumura)