

website launched: 19th March,2018
last updated:26th March, 2018
Shinmoedake amongst the Kirishima volcano group in Kyushu, Japan, erupted on 1st March, 2018.
Volcanic tremor beneath Shinmoedake of the Kirishima volcano complex.
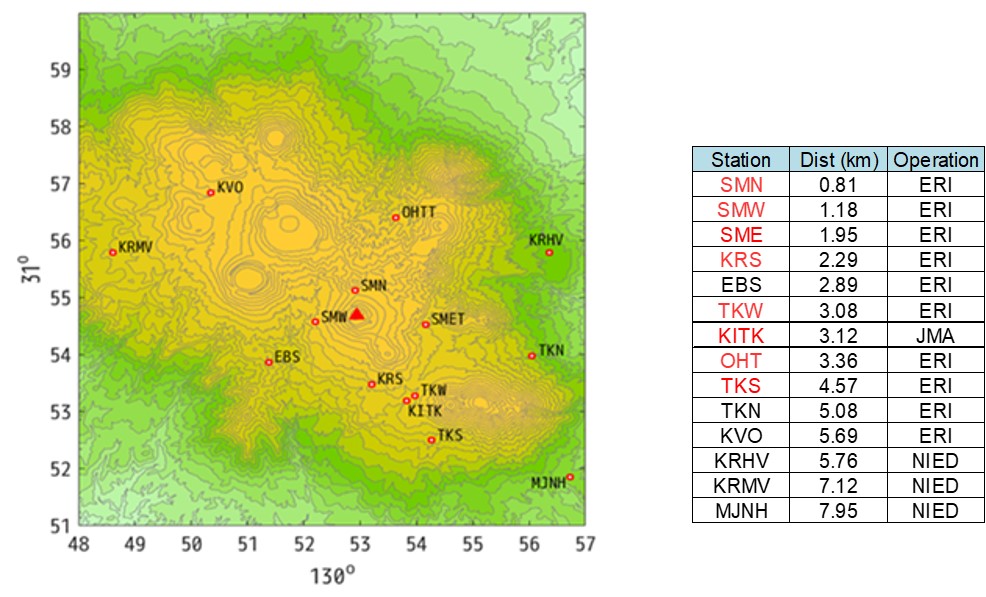
We analyzed the tremor activity from October 3 2017 to the eruption in March 2018 mainly using the data recorded at stations operated by ERI close to the active crater of Shinmoedake.
Below are the findings :
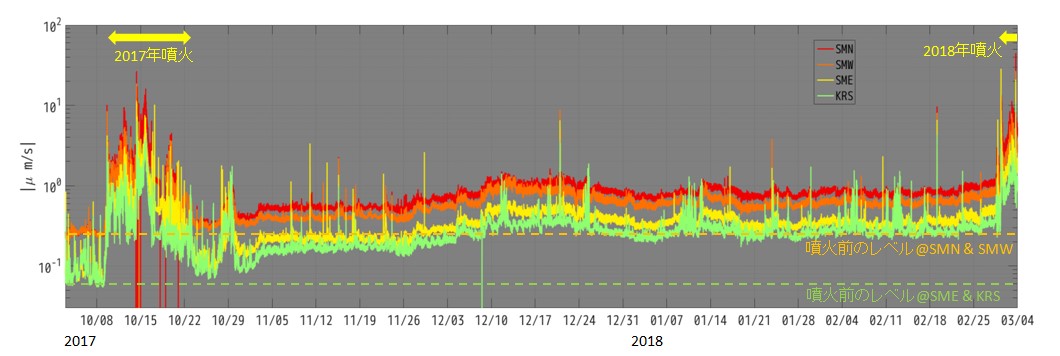
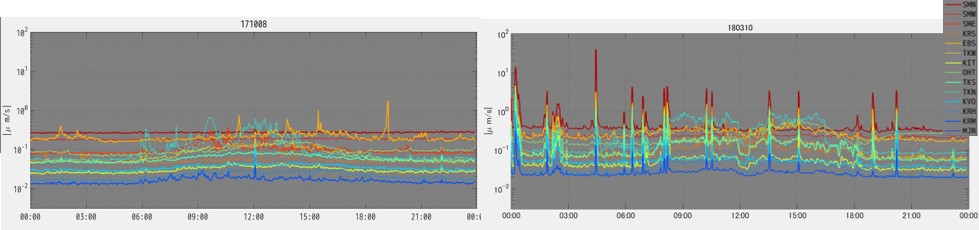
(1) After the eruption on October 11 2017, ground oscillation amplitude did not get back to the level it had before the eruption but gradually increased.
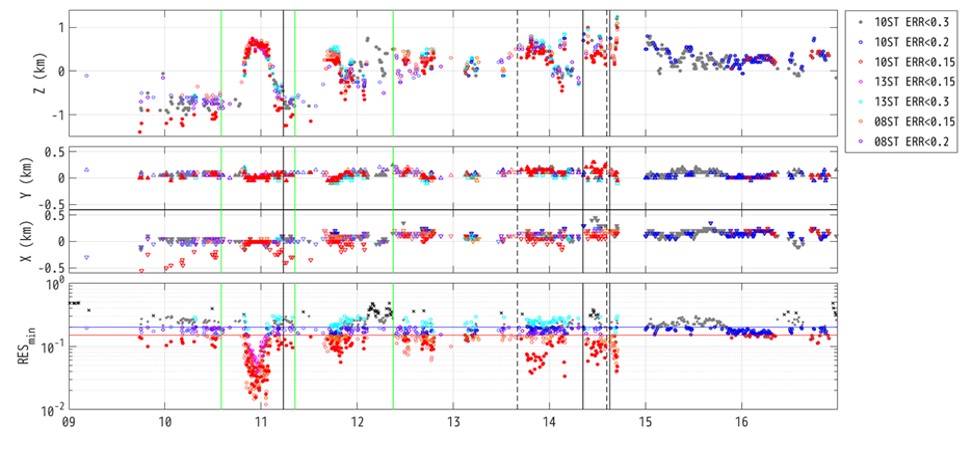
(2) Tremor source locations that were resolved by the analysis concentrated around the sea level beneath the crater of Shinmoedake.
(3) The tremor source moved between 1.5km below sea level in the northwest and just above sea level near the center of Shinmoedake, which occurred several times.
(4) After the eruption on March 1 2018, the tremor source locations shifted to beneath the northeastern rim of the Shinmoedake crater, which is consistent with the location where lava outflew in the crater (NIED Daichi2. 1st report on terrain change inside Shinmoedake crater).
Since March 10 2018 when Vulcanian activity began, the lower limit of the ground motion amplitude nearly returned to the level before the October 2017 eruption.
※Method for analyzing the tremor source (Ichihara & Matsumoto, 2017, GRL)
The root mean square (RMS) of the ground velocity (three components) in the frequency range of 3.5—7 Hz was calculated in every 10 seconds. Then the median value in a 5-minute-long time window shifted every minute is taken as the amplitude value. We selected time windows in which the standard deviation of the amplitude ratio between each pair of the seismic stations in 10 min is smaller than a threshold value. Site corrections for the stations and estimation of average Q value of the area were done using amplitude distribution when stable tremor was clearly seen (between 21:30, October 10 to 01:00, October 11, 2017). The Q value was determined so as to be equivalent with that in the previous study (Ichihara & Matusmoto, 2017).
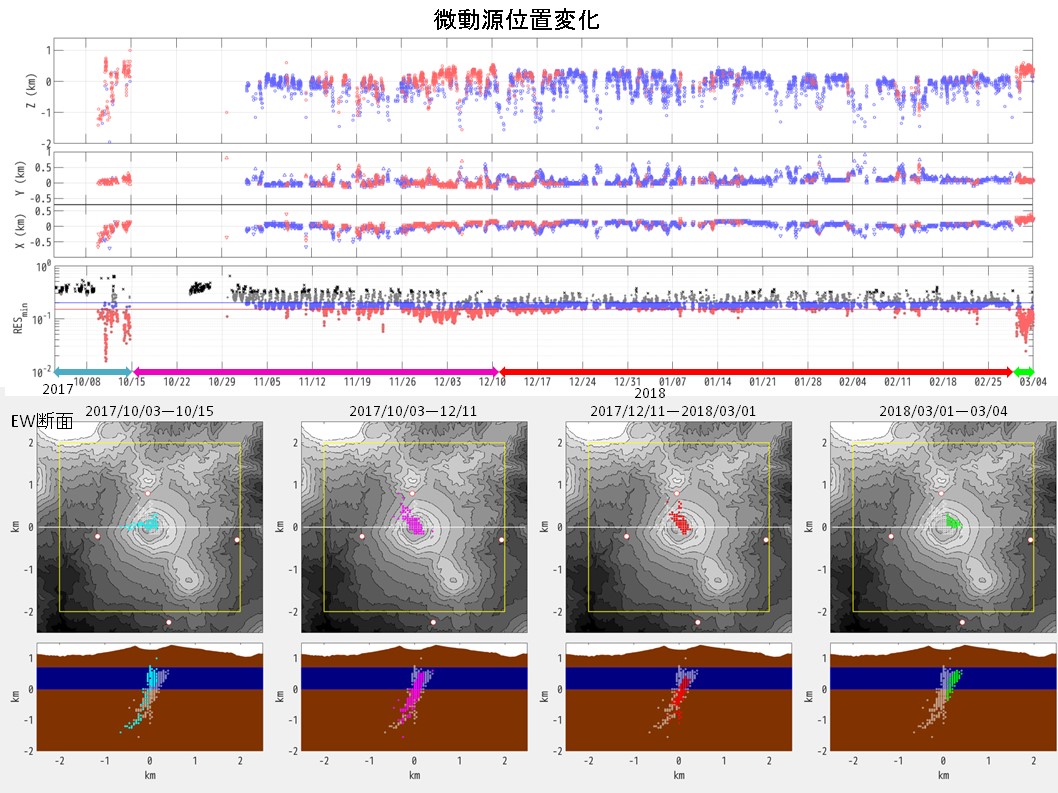
Tremor sources in the periods marked by the colored arrows are indicated in the corresponding colors on the topographic map and the east-west cross section beneath the crater.
(Volcano Research Center: Mie Ichihara /Takao Ohminato )
15th March, 2018
Movie taken on 14th March, 2018
(Volcano Research Center: Fukashi Maeno)
12th March, 2018
Overview:
- Lava kept growing inside the crater as a form of lava dome. The crater was filled with lava dome by midnight 8th, and stranded on the northwestern rim which is the lower part.
- The state of lava dome is clearly captured by satellite SAR analysis, and it seems that lava supply stopped almost by 9th (citation 1, 2)
- Explosive eruption began in the afternoon of 9th, at the center of the lava dome that stopped growing.
- The lava that stranded on northwestern rim flew slowly down the slope by its own weight.
- The process of lava outflow and successive explosive eruptions resembles the process of eruption in January-February 2011.
*GSI’s correspondence to the Shinmoedake eruption in March 2018: http://www.gsi.go. jp/BOUSAI/h30kirishima-index. htm
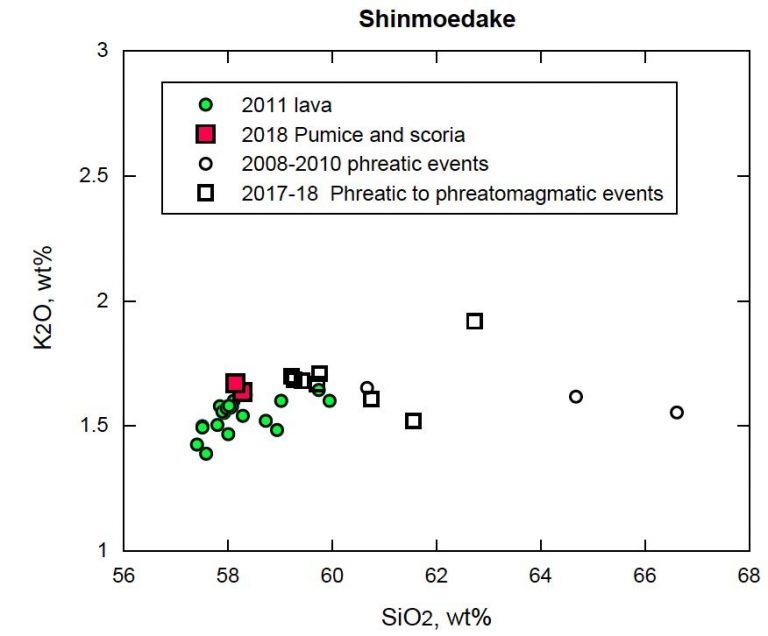
【Magma composition of Shinmoedake 2018 eruption】
The bulk chemical composition of pumice fragments and volcanic ash collected by evening March 7, 2018 was determined. (collected location: Near Shin-yu three-way street, collected by Fukashi Maeno on March 7)
*The magma of this eruption is andesite which is almost the same as of the magma in 2011 eruption.
* Like how it was in 2011 eruption, it is clear that the composition of volcanic ash from preceded phreatic to phreatomagmatic eruptions, had turned magmatic over time. This is a reflect of gradual decay in amount of altered materials within the volcanic ash. (Note that, as used samples are coarse ash and several mm-size pumice fragments, it may be a little different from the true composition of magma including phenocryst.)
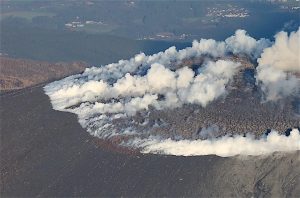
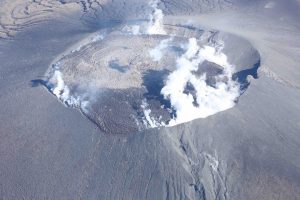
【Aerial observation】
We observed the summit crater of Shinmoedake from the air. Summary is as follows:
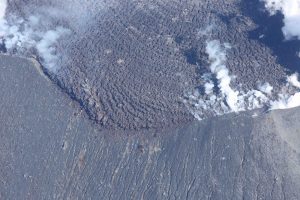
- Concentric growth patterns are well developed on the surface of lava dome accumulated at the summit crater of Shinmoedake.
- The central part of lava dome is almost flat or recessed, and covered with brownish ash. It is considered that the central part is the explosion point and also was the magma supply location. (fig.2)
- When observed on 9th March 5PM, lava stranded on northwestern rim, with steam smoke rising from its tip. At 3:30PM on the following day, the tip headed down the slope and its surface was rusty due to oxidation. (fig.3, 4)
- It seems that the tip of the lava has advanced several tens of meters in a day, without any large collapse.
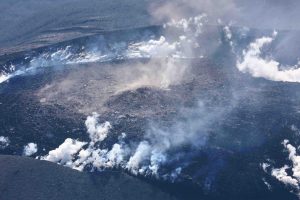
- About 10 minutes before the explosion around 10:15AM on March 10, volcanic ash started to emit weakly from the ash-covered central part, and then a bulge appeared forming a circular cone, leading to eruption (Fig. 5).
(Chartered Cessna and helicopters from KYT and UMK were used for observation)
(Volcano Research Center: Setsuya Nakada)