

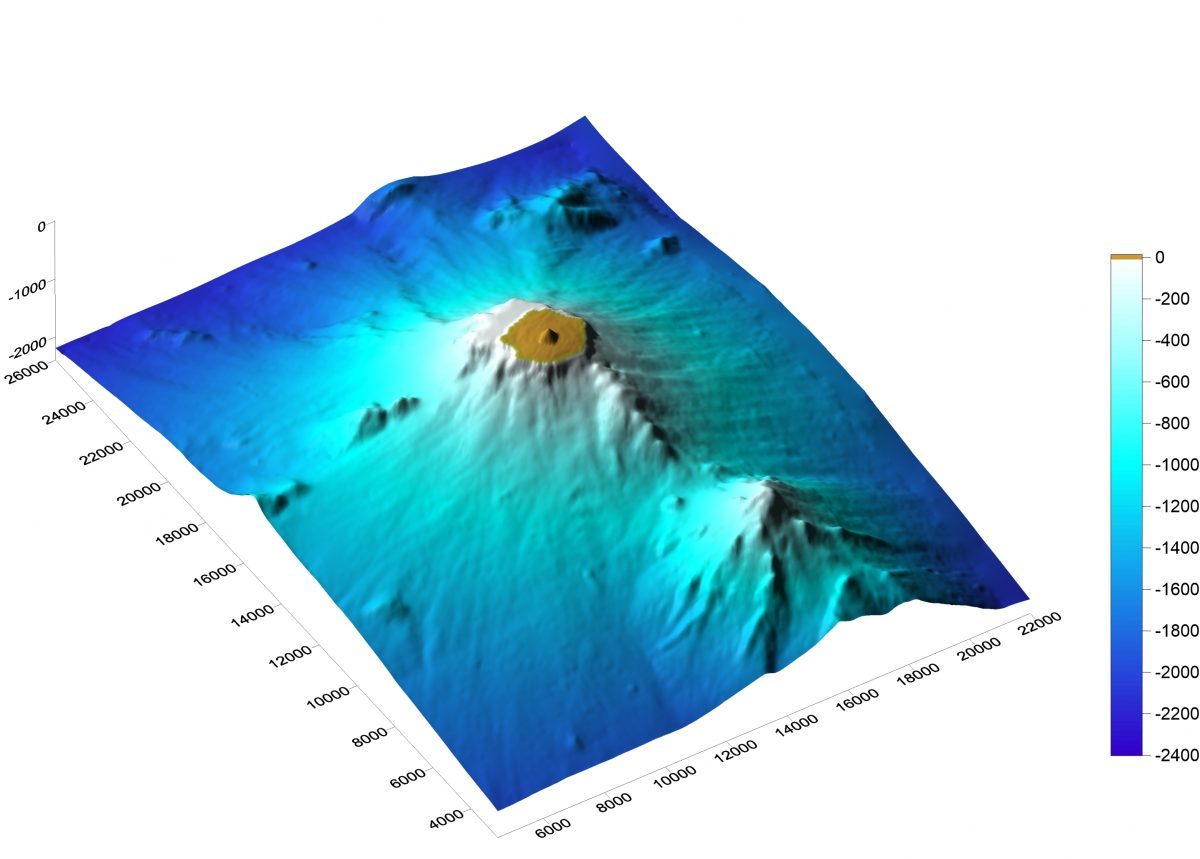
Volcanic activity of Nishinoshima island amongst Bonin Islands, has been continuing since 2013 and the island is rapidly expanding due to its repeated lava outflows.
In October 2016 and September 2019, our team landed on the previously formed part of the island, and installed seismometers and infrasound sensors in between the volcanic activities. The observation instruments installed in October 2016 was lost due to eruptions in April 2017, but fortunately, seismic and infrasound signals just before and after the beginning of the eruption was recorded. In September 2019, our team landed again on the previously formed land that was not covered by lava flows, and re-installed the instrument consisting of 3-component broadband seismograph and infrasound sensor. This report introduces the observation that began in September 2019.
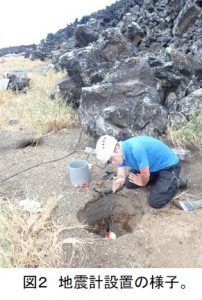
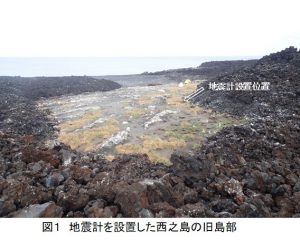
Most of the older part of the island was covered by repeated lava outflow, but as of September 2019, soil surface was slightly left and many sea birds inhabited (fig.1). We buried the seismometer, digging a hole of 30cm deep hole on a tiny piece of the soil covered land that was not covered by lava flows (fig.2).
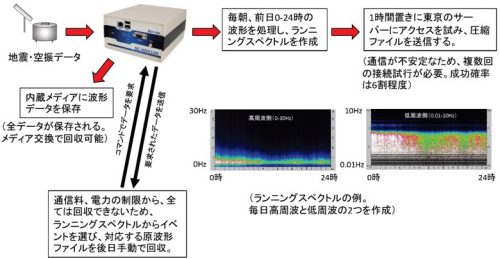
The electric power for observation instruments are supplied by solar panels, and the data are sent to ERI via satellite link.
Due to the limitation in satellite communication capacity and cost, it is not possible to transmit all the recorded data, so the data were collected by the following procedure:
- After one day of observation, the local logger creates and compresses the running spectrum for the previous day, and send it to ERI.
- Check the running spectrum manually and if an earthquake or any other events occur, we manually cut out the data at the relevant time and collect them later.
- This procedure made it possible to grasp the overview of the volcanic activity under limited communication conditions.
(Volcano Research Center: OHMINATO Takao )