Slow slip event within a gap between tremor and locked zones in the Nankai subduction zone
Slow slip event within a gap between tremor and locked zones in the Nankai subduction zone
R. Takagi(1, 2), K. Obara(1), T.Maeda(1)
1Earthquake Research Institute, The University of Tokyo, 2 Tohoku University
Geophysical Research Letters, 43, 1066-1074, doi:10.1002/2015GL066987, 2016.
We report on two small long-termslow slip events (SSEs) within a gap between tremor and locked zones in the Nankai subduction zone, southwest Japan. The SSEs were detected by subtracting the steady state component and postseismic effects of large earthquakes from long-term and high-density Global Navigation Satellite Systemdata. Both SSEs occurred in adjacent regions of the Bungo channel following long-term SSEs in the Bungo channel in 2003 and 2010. The estimated slip was 1–5 cm/year that lasted at least 1–2 years after 2004 and 2011, partly accommodating plate convergence. As the low-frequency tremor in the downdip region is activated at the same time as the Bungo channel long-term SSE, a spatiotemporal correlation was observed between the detected SSEs and long-term tremor activity in the downdip region. This correlation indicates along-dip interaction of the slips on the subducting plate interface.
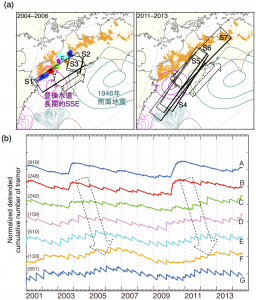
Figure 1. (a) Map of the Nankai subduction zone. Orange dots represent the epicenters of low-frequency tremor [Obara et al., 2010]. Thick cyan contours denote 1 (dashed), 2, 5, and 10 m slip for the 1946 Mw 8.3 Nankai earthquake [Sagiya and Thatcher, 1999]. Thick purple contours indicate the 2010 Bungo channel long-term SSE with 10 cm intervals [Geospatial Information Authority of Japan, 2014]. Red dots and red dashed line indicate low-frequency tremor and VLFEs activated by the 2010 Bungo channel long-term SSE [Hirose et al., 2010]. Thin cyan (intervals of 50 cm) and thin purple (intervals of 2 cm and the minimum contours of 4 cm) contours indicate coseismic and postseismic slip distributions, respectively, of Hyuga-nada earthquakes [Yagi et al., 1998, 2001]. Black arrows indicate the movement of the Philippine Sea plate relative to the Amurian plate [Miyazaki and Heki, 2001]. The geometry of the plate interface is represented by gray dashed lines [Baba et al., 2002; Hirose et al., 2008]. Gray dots are GEONET stations. Solid black rectangles are the reference GEONET stations. AM, PH, NA, and PA in the inset map represent the Amurian Plate, the Philippine Sea Plate, the North American Plate, and the Pacific Plate, respectively.
(b) Time series of horizontal GNSS displacements in the direction of N130°E (gray dots). Blue and red curves show time series of the cumulative number of tremor in red and blue regions in Figure 1a, respectively. Steady state trends within 2007–2008 are removed from the time series of GNSS and tremor (linear, annual, and biannual trends for GNSS, and linear trends for tremor). The Bungo channel long-term SSEs occurred in the shaded time windows. Black horizontal bars show time periods in which small long-term SSEs were detected between the tremor and locked zones. Linear trends of GNSS displacements after 2011 are indicated by gray dashed lines with the slope values.Figure 2. (a) Estimated rectangular faults in 2004–2006 and 2011–2013. S1–S7 are estimated fault models for the periods of one year from April 2004, October 2004, April 2005, April 2011, October 2011, April 2012, October 2012, respectively. Contours are as in Figure 1a, except for thick purple contours representing the 2003 and 2010 Bungo channel long-term SSEs. Capital letters A to G indicate the tremor regions used in Figure 2(b) (b) Long-term variations in tremor activity at regions of A–G indicated in Figure 2(a). Each line shows the normalized cumulative number of tremors in each region in Figure 3a after subtracting the linear trend within the whole time window.


![Figure 1. (a) Map of the Nankai subduction zone. Orange dots represent the epicenters of low-frequency tremor [Obara et al., 2010]. Thick cyan contours denote 1 (dashed), 2, 5, and 10 m slip for the 1946 Mw 8.3 Nankai earthquake [Sagiya and Thatcher, 1999]. Thick purple contours indicate the 2010 Bungo channel long-term SSE with 10 cm intervals [Geospatial Information Authority of Japan, 2014]. Red dots and red dashed line indicate low-frequency tremor and VLFEs activated by the 2010 Bungo channel long-term SSE [Hirose et al., 2010]. Thin cyan (intervals of 50 cm) and thin purple (intervals of 2 cm and the minimum contours of 4 cm) contours indicate coseismic and postseismic slip distributions, respectively, of Hyuga-nada earthquakes [Yagi et al., 1998, 2001]. Black arrows indicate the movement of the Philippine Sea plate relative to the Amurian plate [Miyazaki and Heki, 2001]. The geometry of the plate interface is represented by gray dashed lines [Baba et al., 2002; Hirose et al., 2008]. Gray dots are GEONET stations. Solid black rectangles are the reference GEONET stations. AM, PH, NA, and PA in the inset map represent the Amurian Plate, the Philippine Sea Plate, the North American Plate, and the Pacific Plate, respectively. (b) Time series of horizontal GNSS displacements in the direction of N130°E (gray dots). Blue and red curves show time series of the cumulative number of tremor in red and blue regions in Figure 1a, respectively. Steady state trends within 2007–2008 are removed from the time series of GNSS and tremor (linear, annual, and biannual trends for GNSS, and linear trends for tremor). The Bungo channel long-term SSEs occurred in the shaded time windows. Black horizontal bars show time periods in which small long-term SSEs were detected between the tremor and locked zones. Linear trends of GNSS displacements after 2011 are indicated by gray dashed lines with the slope values.](http://www.eri.u-tokyo.ac.jp/old/en/wp-content/uploads/sites/3/2016/03/Fig1-300x169.png)
