

Andrew A. Delorey,1 Kevin Chao,2 Kazushige Obara,3 Paul A. Johnson1
1 Los Alamos National Laboratory 2 Massachusetts Institute of Technology 3 Earthquake Research Institute, The University of Tokyo
Science Advances, 16 Oct 2015, Vol. 1, no. 9, e1500468, DOI: 10.1126/sciadv.1500468
Cascading elastic perturbation in Japan due to the 2012 Mw 8.6 Indian Ocean earthquake
Since the discovery of extensive earthquake triggering occurring in response to the 1992 Mw (moment magnitude) 7.3 Landers earthquake, it is now well established that seismic waves from earthquakes can trigger other earthquakes, tremor, slow slip, and pore pressure changes. Our contention is that earthquake triggering is one manifestation of a more widespread elastic disturbance that reveals information about Earth’s stress state. Earth’s stress state is central to our understanding of both natural and anthropogenic-induced crustal processes. We show that seismic waves from distant earthquakes may perturb stresses and frictional properties on faults and elastic moduli of the crust in cascading fashion. Transient dynamic stresses place crustal material into a metastable state during which the material recovers through a process termed slow dynamics. This observation of widespread, dynamically induced elastic perturbation, including systematic migration of offshore seismicity, strain transients, and velocity transients, presents a new characterization of Earth’s elastic system that will advance our understanding of plate tectonics, seismicity, and seismic hazards.


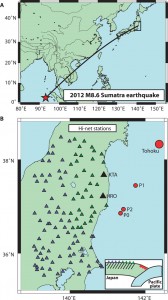
(A to C) Cycle of stress transfer from (A) plate interface to shallow fore arc (B) resulting in normal faulting earthquakes and (C) stress transfer to interior Honshu Island. Blue triangles represent Hi-net stations. Red stars are normal faulting earthquakes.