Satoru Baba1, Akiko Takeo1, Kazushige Obara1, Aitaro Kato1, Takuto Maeda1, Takanori Matsuzawa2
1Earthquake Research Institute, The University of Tokyo 2National Research Institute for Earth Science and Disaster Resilience
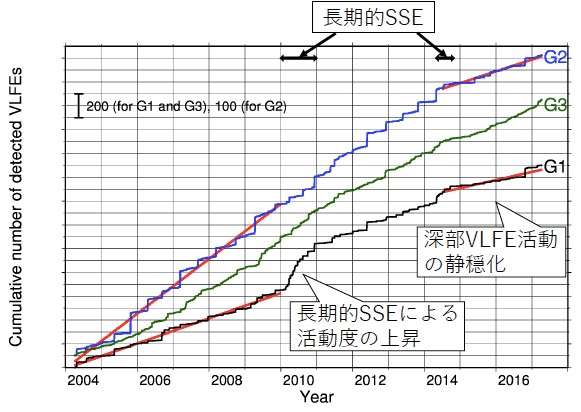
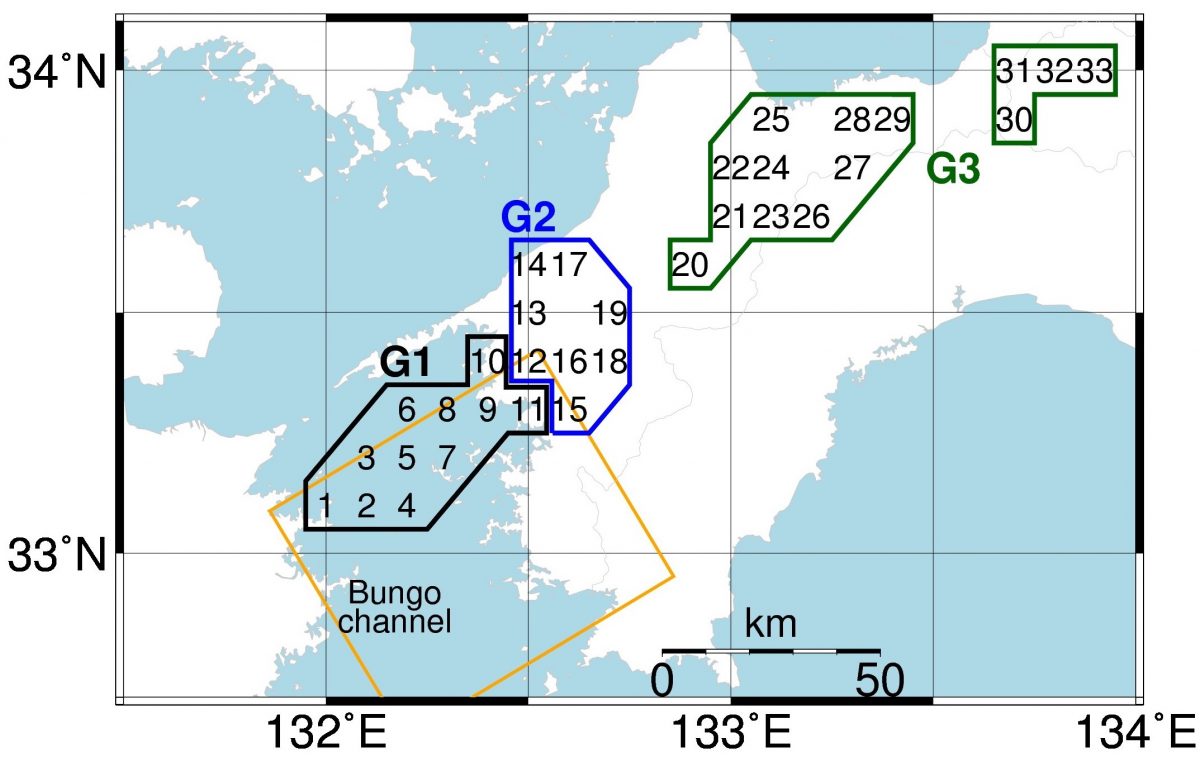
Various types of slow earthquakes have been detected on plate interfaces near the seismogenic zones of megathrust earthquakes. We investigated long-term changes of deep very low frequency earthquake (VLFE) activity over a period of 13 years in Shikoku region, southwest Japan. VLFEs can be categorized as slow earthquakes. VLFE activity is expected to be a proxy of interplate slips. In the Bungo channel (G1 of Figure 1), where long-term slow slip events (SSEs) have been known to occur frequently, the activity of deep VLFEs was modulated by long-term SSEs in 2010 and 2014. VLFE activity is sensitive to the size and area of the neighboring long-term SSEs. In the neighboring inland region (G2 of Figure 1), deep VLFE activity is accompanied by episodic tremors and slips every 6 months. In western Shikoku, the activity of deep VLFEs and tremors has been low since the latter half of 2014 (Figure 2). This decade-scale quiescence may be attributed to the change in interplate coupling strength in the Nankai subduction zone.