Abstract
Global Navigation Satellite System data are inverted to investigate the space-time evolution of five Mw 6.6–6.7 slow slip events (SSEs) off the Boso Peninsula, central Japan, in 1996, 2002, 2007, 2011, and 2013–2014. Our analyses reveal that the nucleation style and space-time evolution of slip vary among the five SSEs. The 2002, 2007, and 2011 SSEs nucleated more rapidly, with moment accelerations higher than those of the 1996 SSE by a factor of ∼2–6, and higher than those of the 2013–2014 SSE by an order of magnitude. Furthermore, the 2002, 2007, and 2011 SSEs exhibited more rapid temporal variations in their slip and moment rates and showed larger seismic moments and higher maximum slip rates than the 1996 and 2013–2014 SSEs, suggesting that the overall evolution of the SSEs is correlated with the nucleation style. The along-strike expansion/propagation of slip is identified for the five SSEs, revealing that the expansion/propagation patterns vary from event to event. The earthquake swarms accompanying the SSEs occurred near the downdip edge of high-slip-rate areas, and the seismicity migrated during slow slip with directions and speeds similar to those of the slip expansion/propagation. These space-time correlations between seismicity and slow slip suggest that the earthquake swarms were triggered by stress changes due to slow slip. The relative timing between the onsets of the SSEs and their associated seismicity varies from event to event and appears to be correlated with the nucleation style of the SSEs.
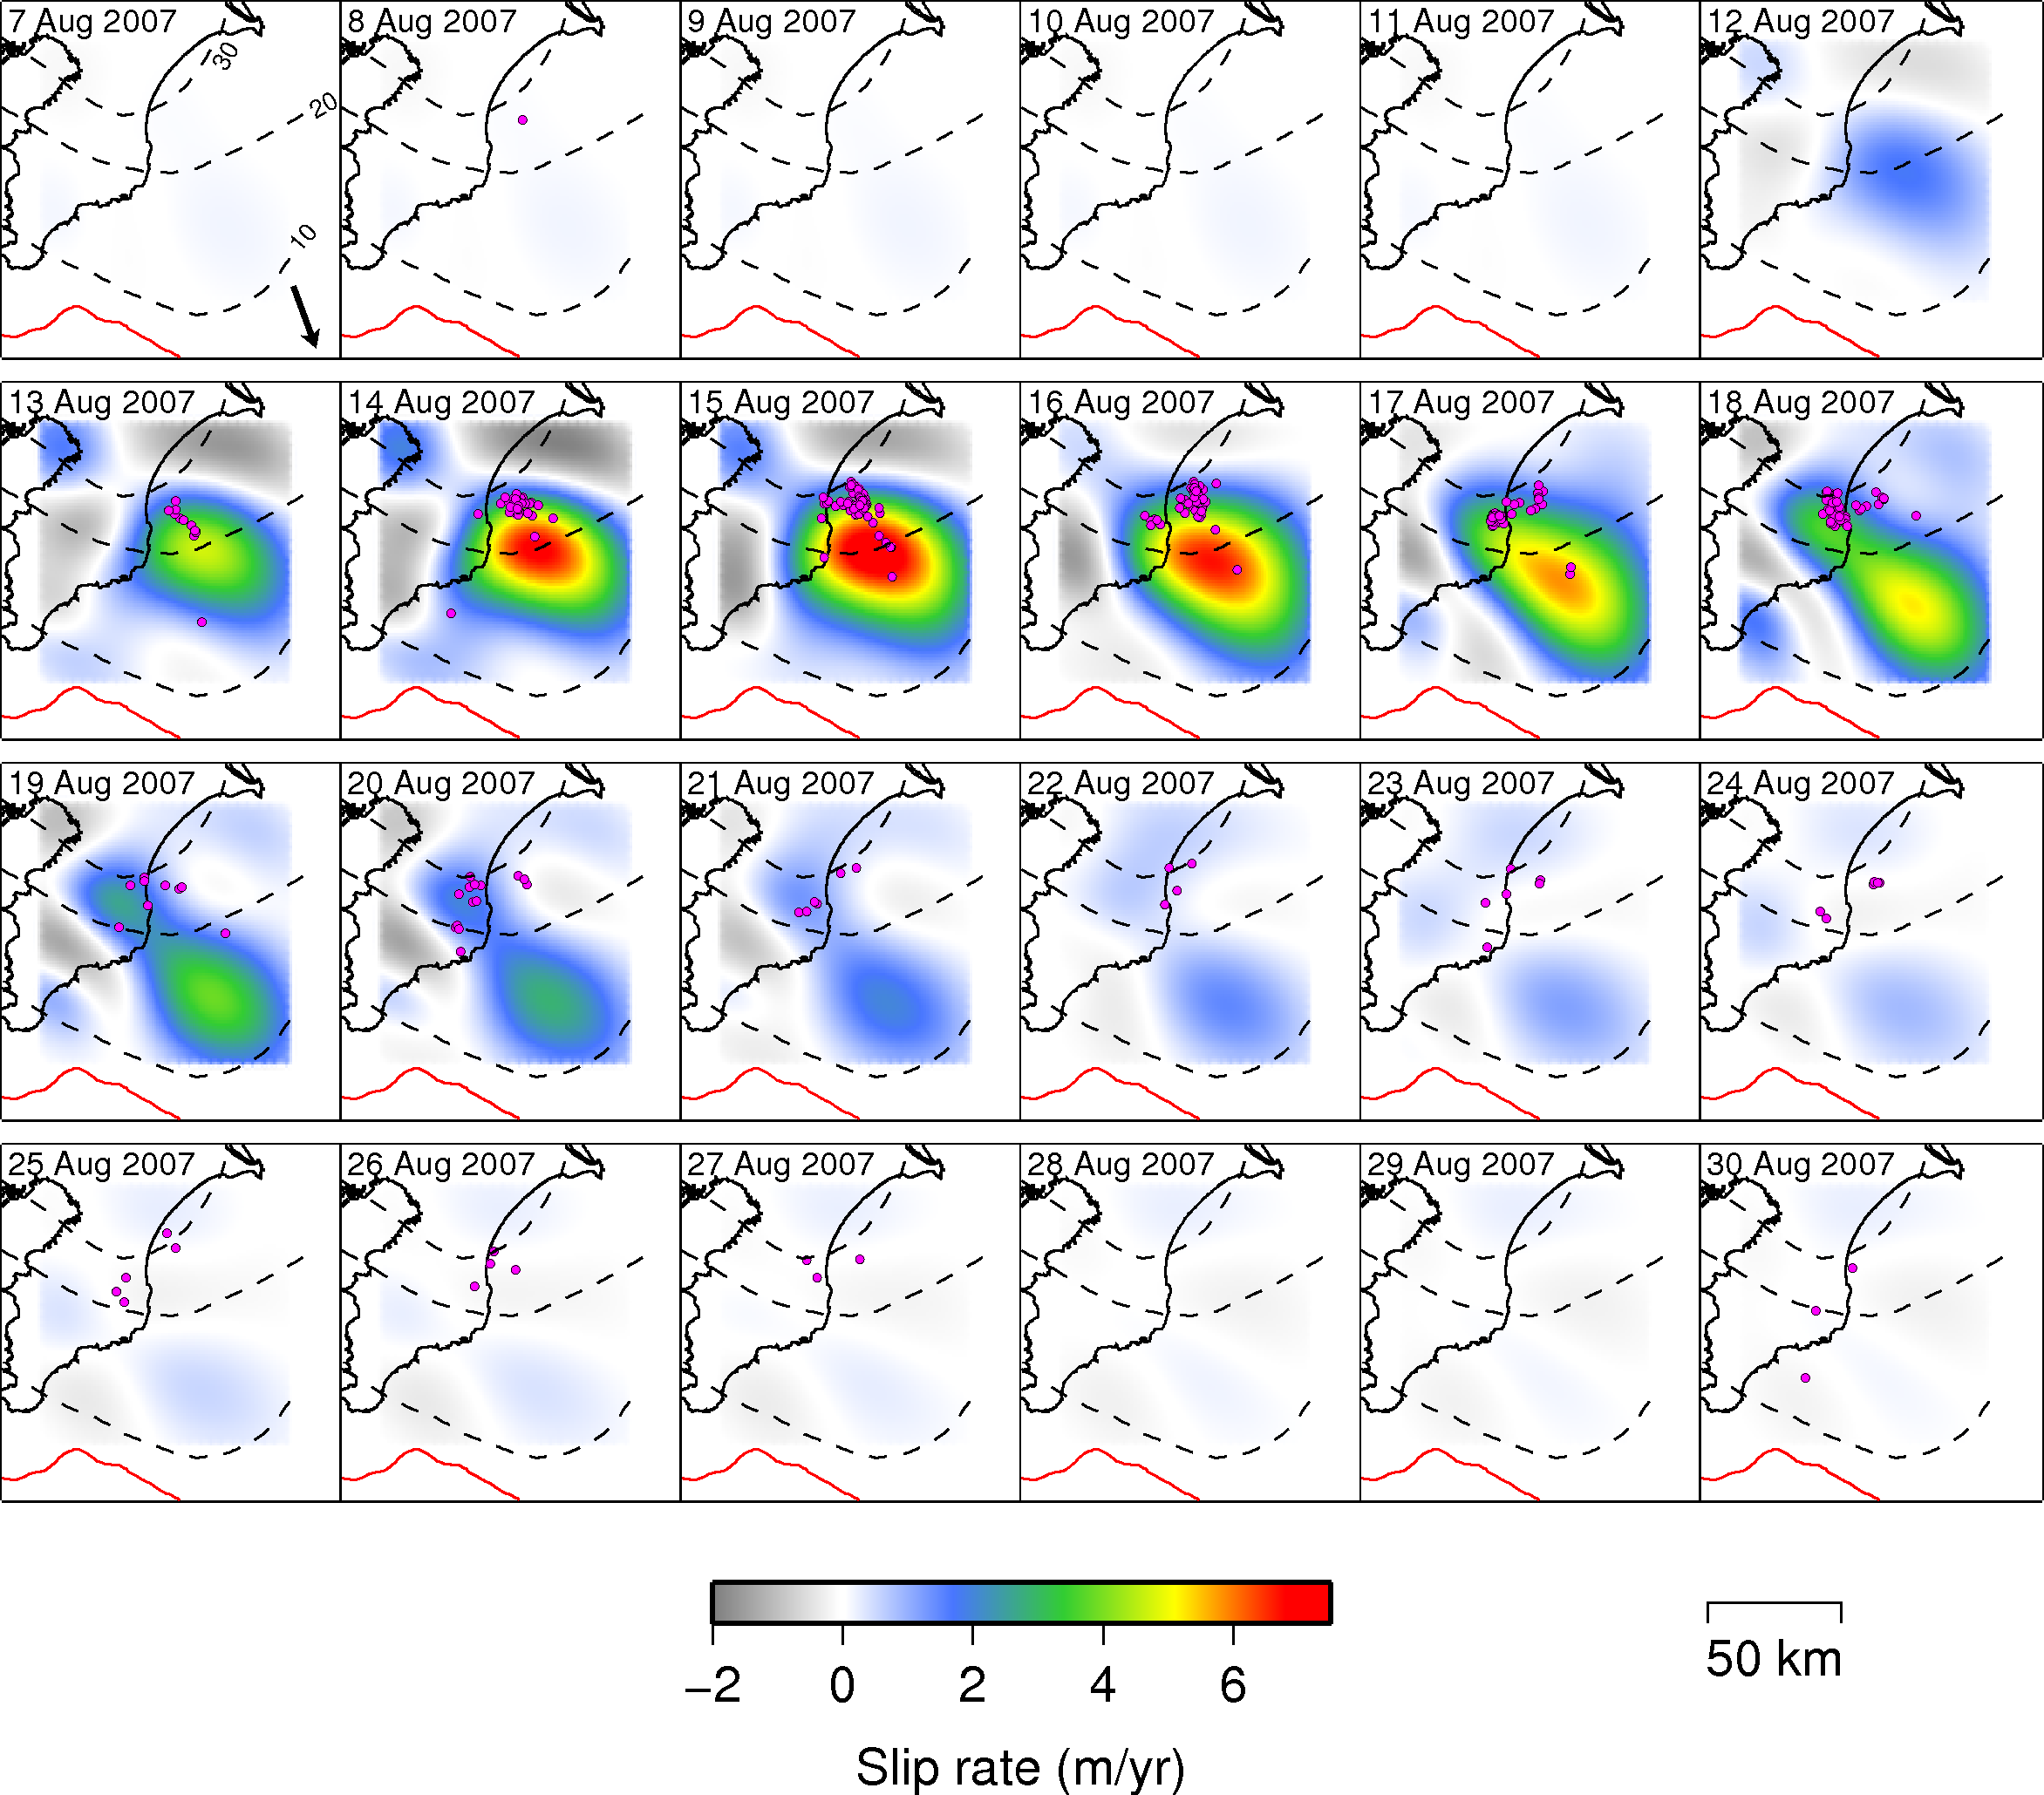
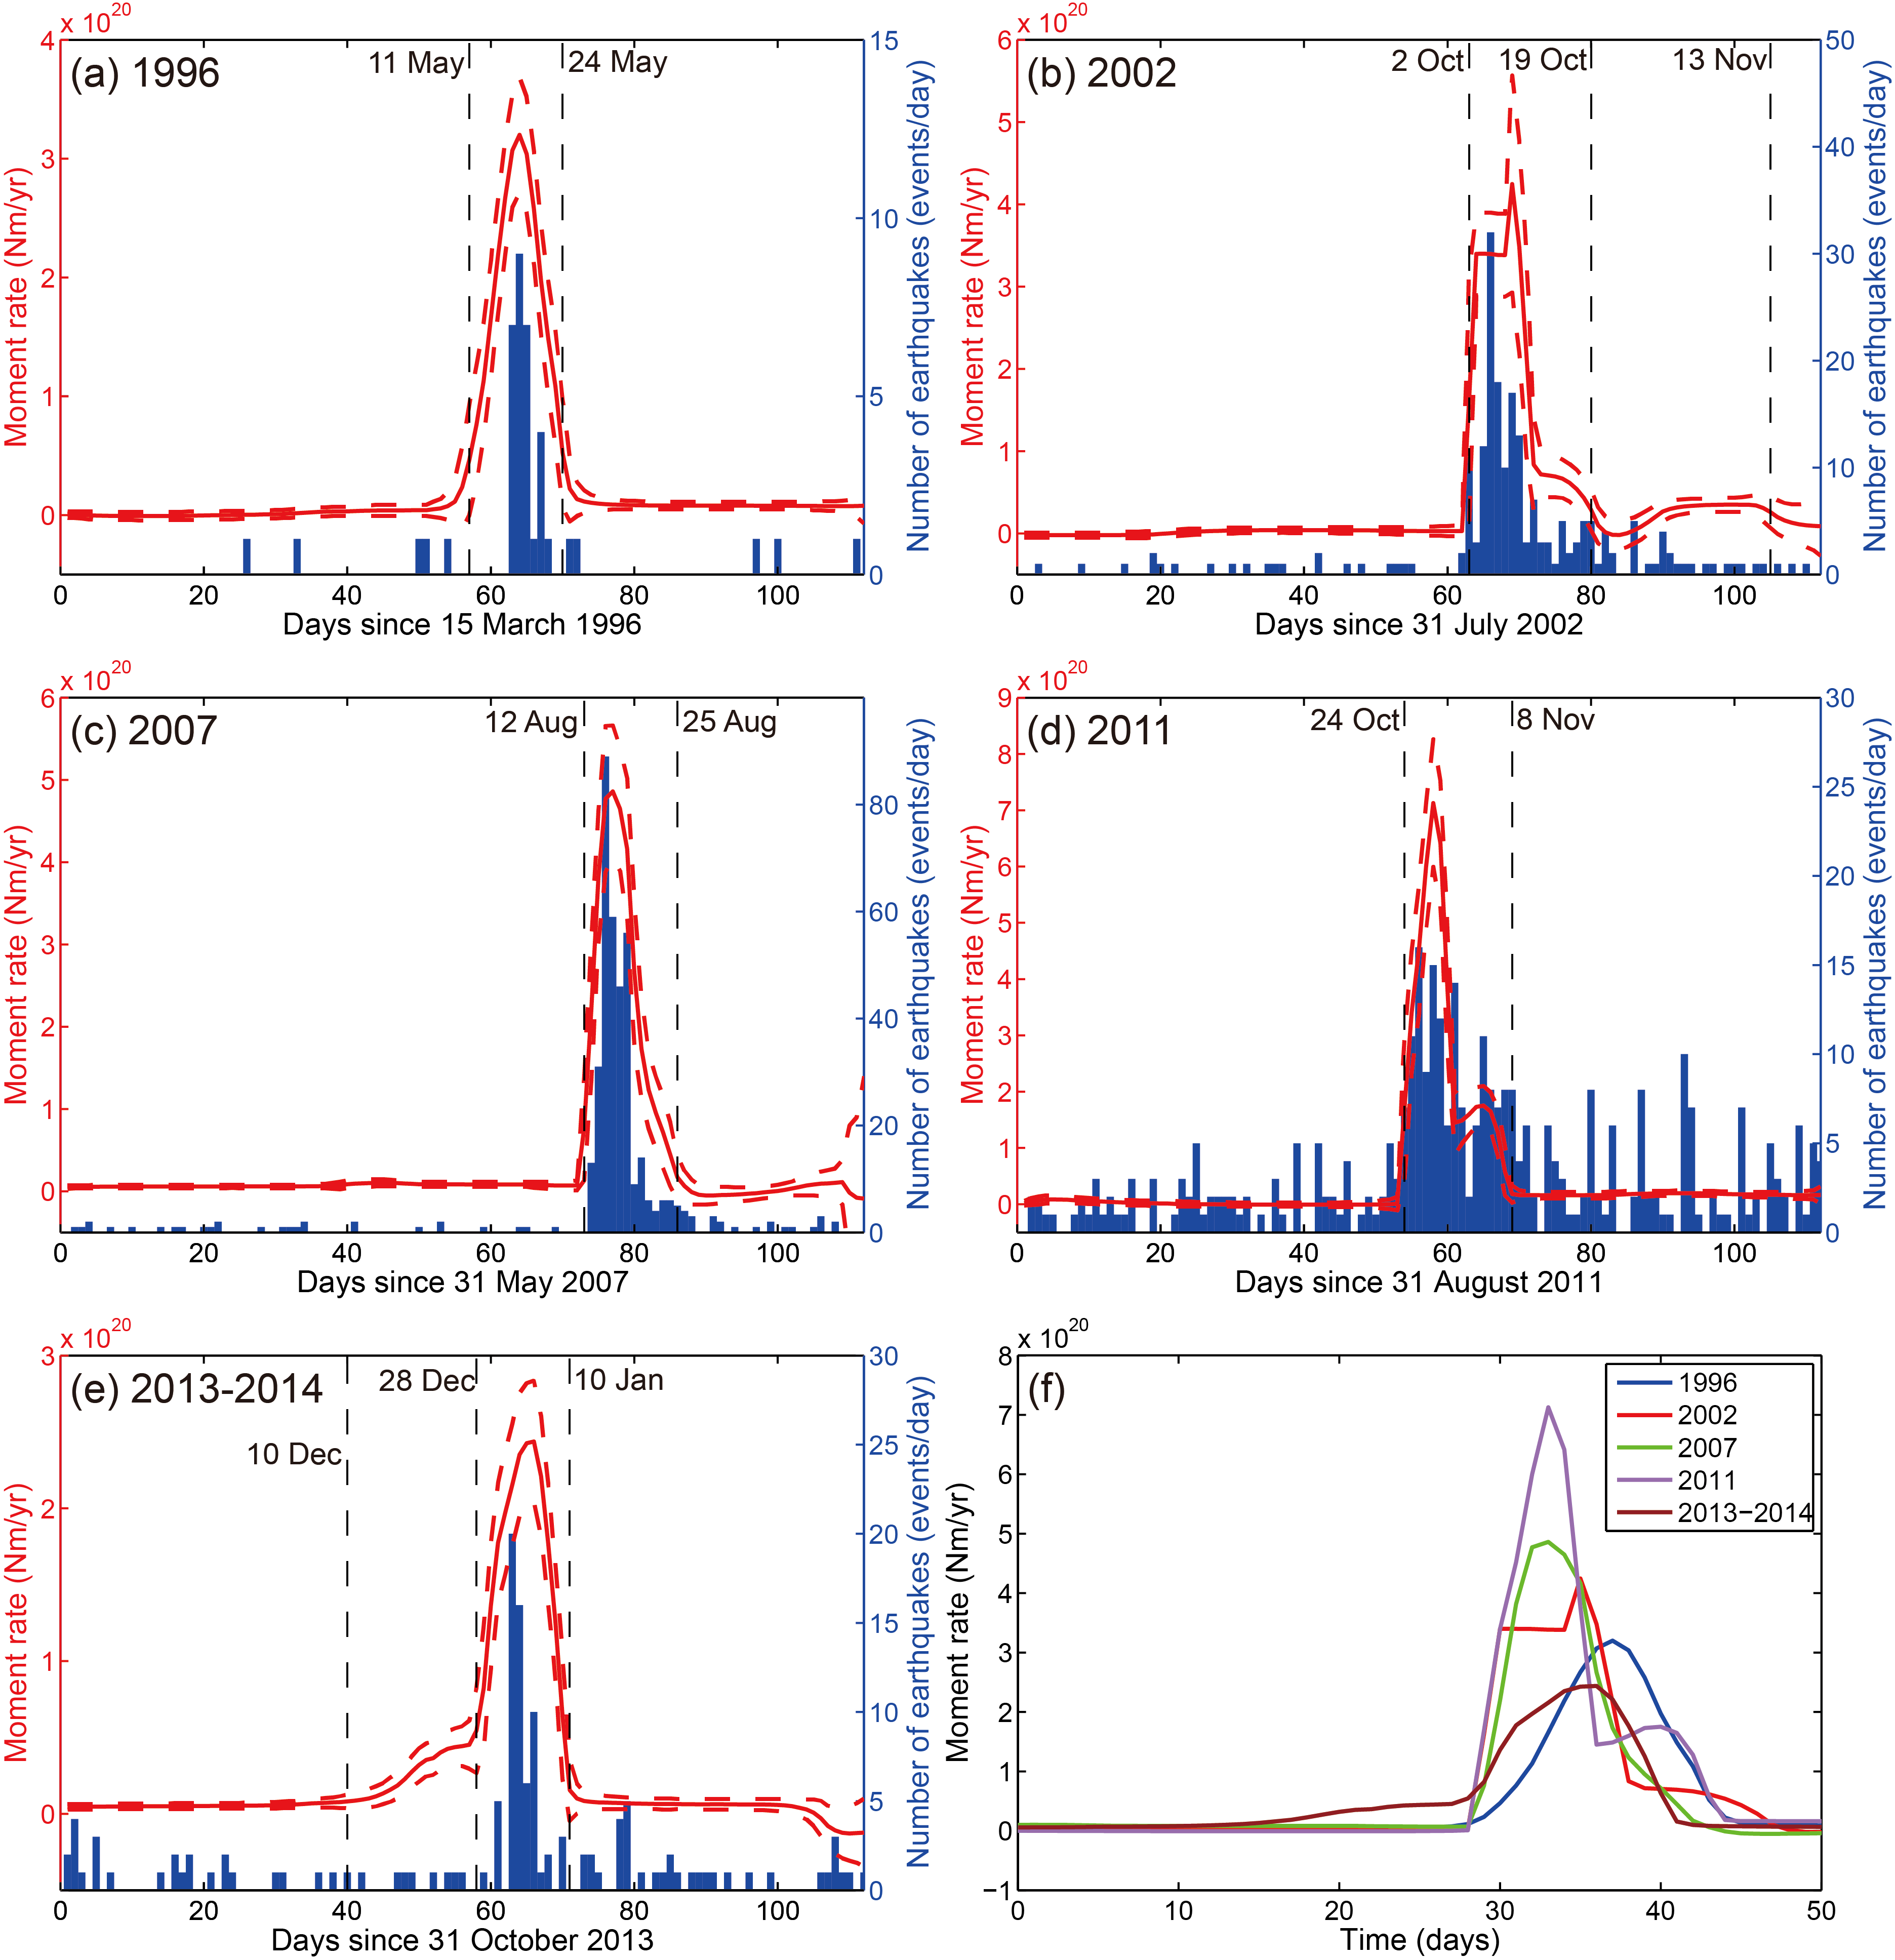
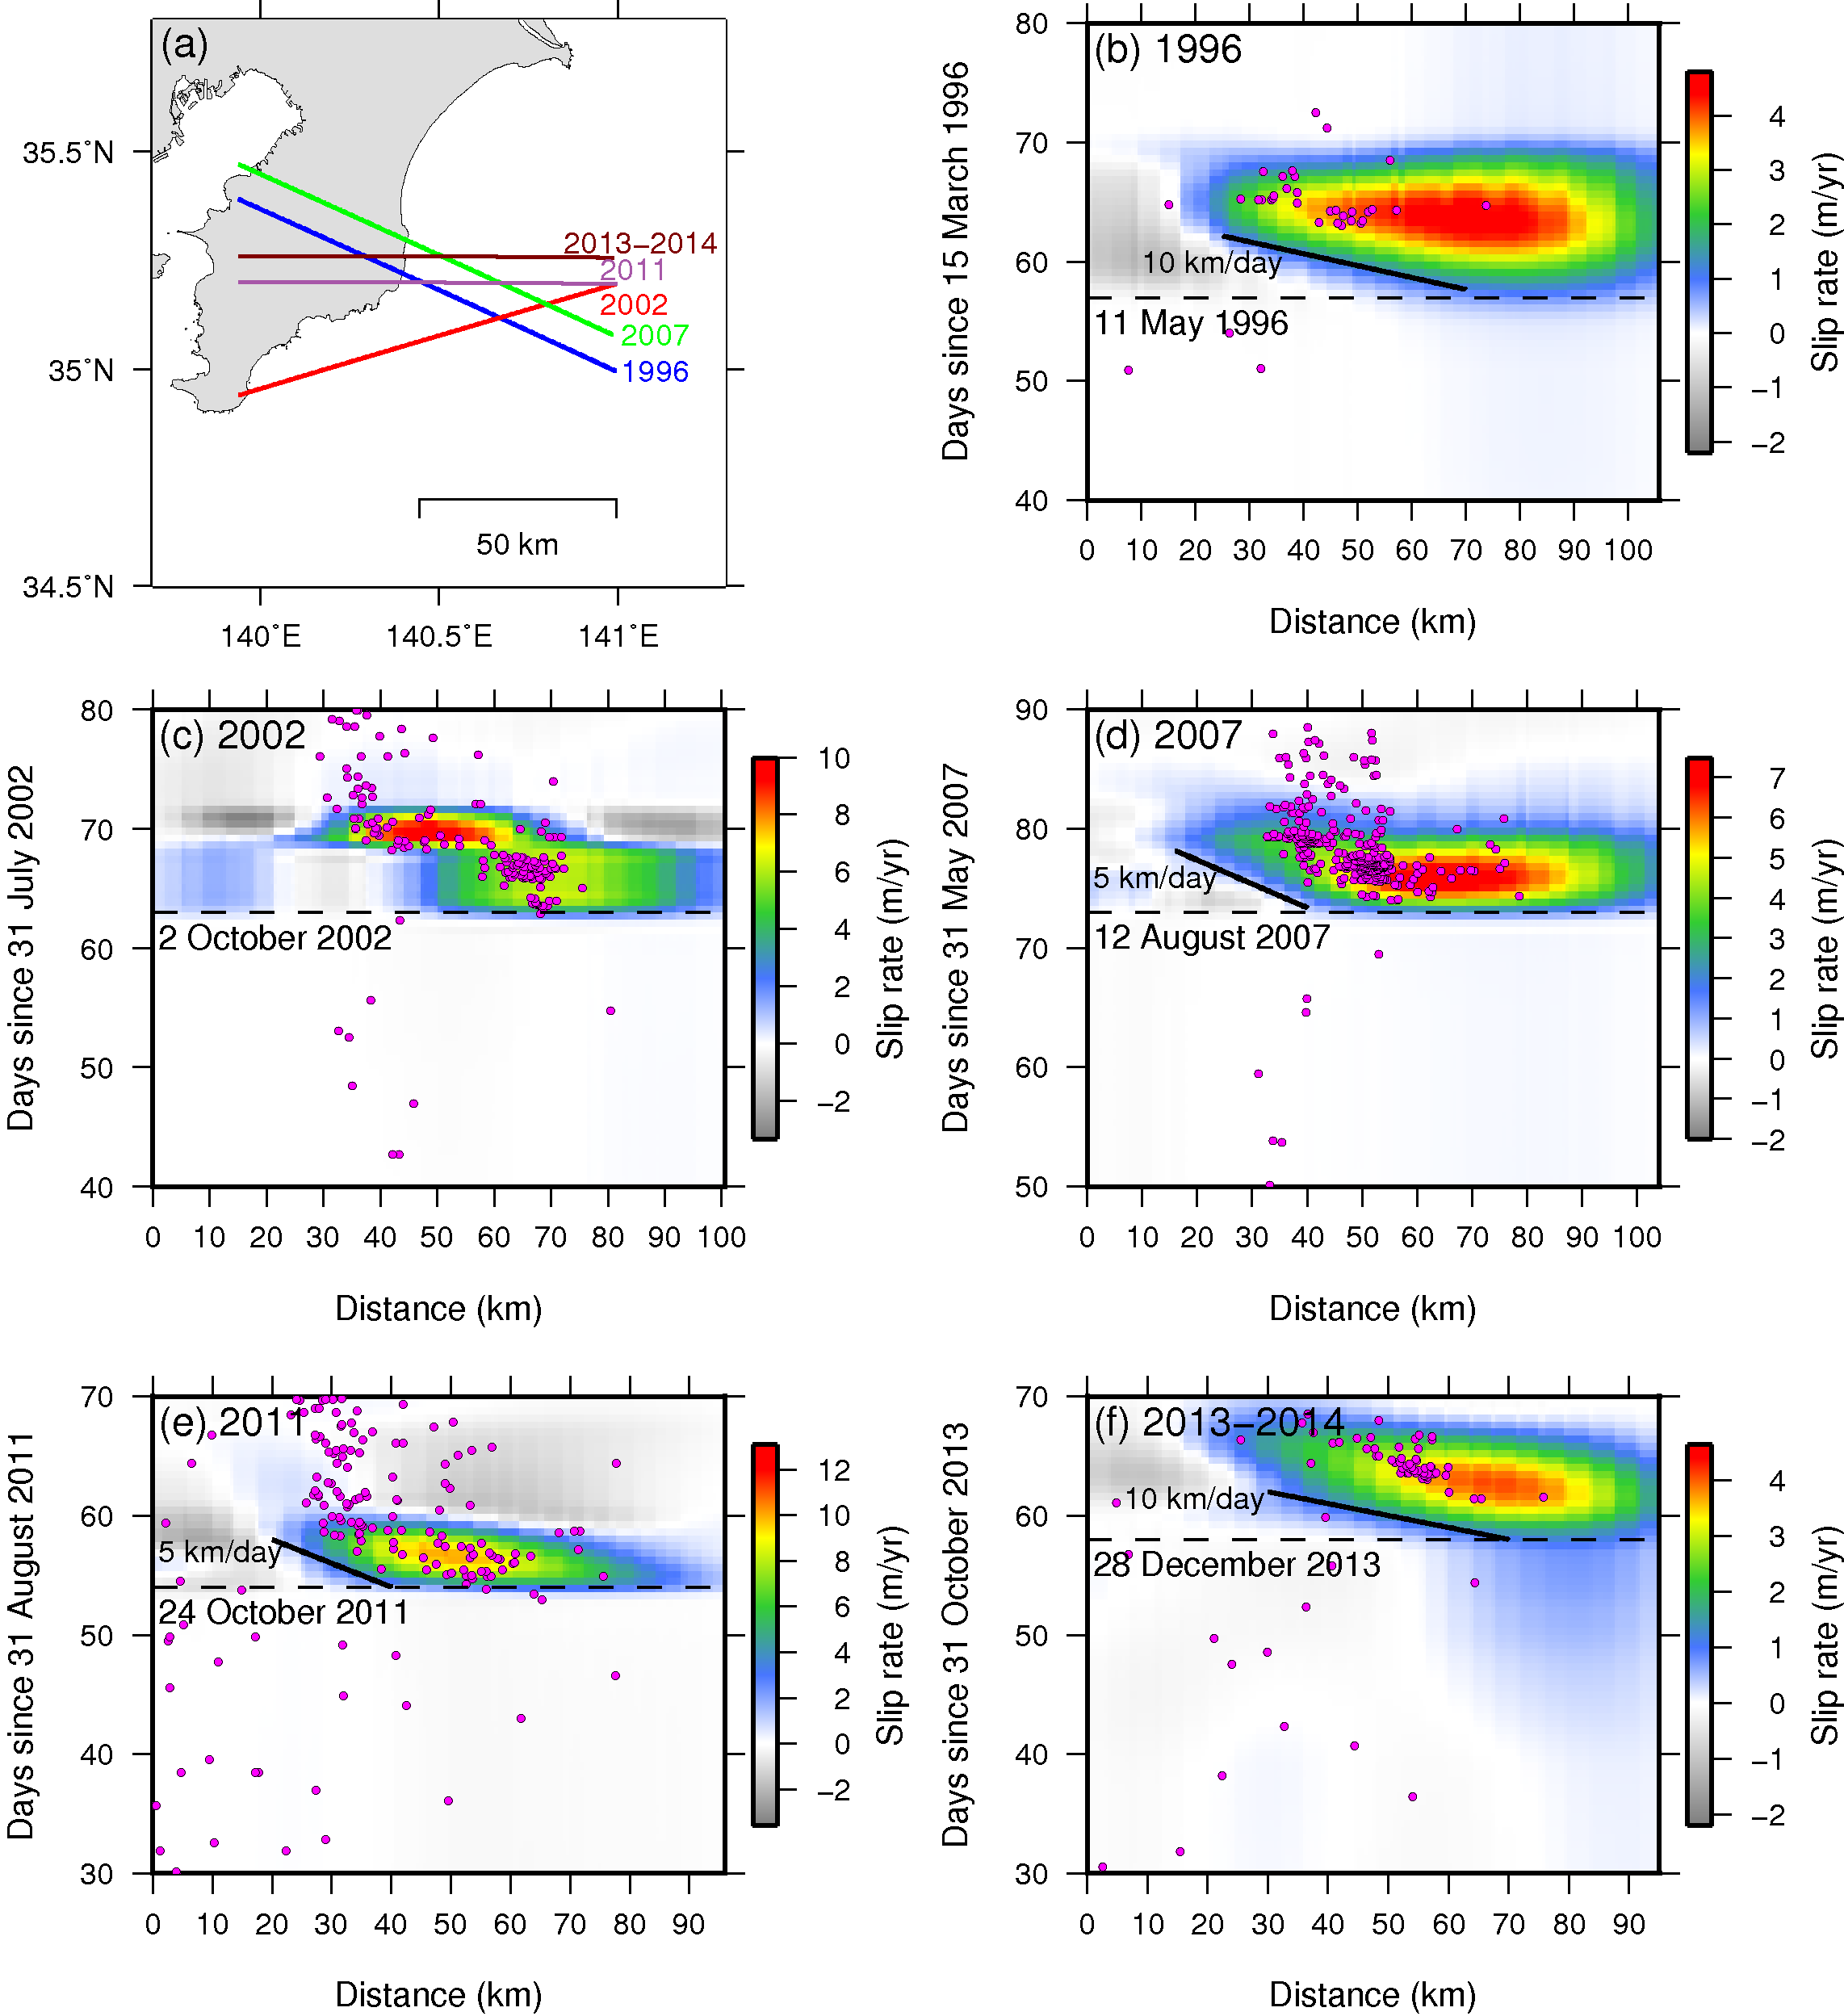
Daily slip rate distribution along the plate interface between 7 and 30 August 2007.Moment rate functions (solid red lines) for each of the SSEs, calculated from the estimated slip rate with a shear modulus of 30 GPa, for the (a) 1996, (b) 2002, (c) 2007, (d) 2011, and (e) 2013–2014 SSEs. Red dashed lines represent the error bounds (one standard deviation) for each moment rate function, and the blue bars denote the number of earthquakes per day. The black dashed lines mark the approximate start, end, and subevent/phase transition of each SSE (see figure for dates). (f) Magnified view of the moment rate functions for the five SSEs shown in a–e. Blue, red, green, purple, and brown curves denote the moment rate functions for the 1996, 2002, 2007, 2011, and 2013–2014 SSEs, respectively, with each of the curves arbitrarily shifted in time for clarity.(a) Map of the Boso Peninsula region, showing the locations of the profiles of the temporal evolution of slip rate for the (b) 1996 (blue line), (c) 2002 (red line), (d) 2007 (green line), (e) 2011 (purple line), and (f) 2013–2104 (brown line) SSEs. Each profile in a represents the approximate expansion/propagation path of slip during the early stages of each SSE. The horizontal axis in b–f represents the distance along each of the lines in a, measured from the western edge; the vertical axis in b–f represents the time of interest for each SSE (see the figure for specific time frames). Solid lines in b–f denote slopes corresponding to the approximate expansion speeds of slow slip. Horizontal dashed lines in b–e mark the initiation of each SSE, and the dashed line in f marks the phase transition of the 2013–2014 SSE (see the figure for dates). Purple circles in b–f represent earthquakes with depths ≤40 km, projected onto each of the lines in a, as a function of time and distance along each of the lines.