S. Takemura1*, T. Matsuzawa2, A. Noda2, T. Tonegawa3, Y. Asano2, T. Kimura2 and K. Shiomi2 (2019).
1ERI, Univ Tokyo 2NIED 3JAMSTEC
https://doi.org/10.1029/2019GL082448
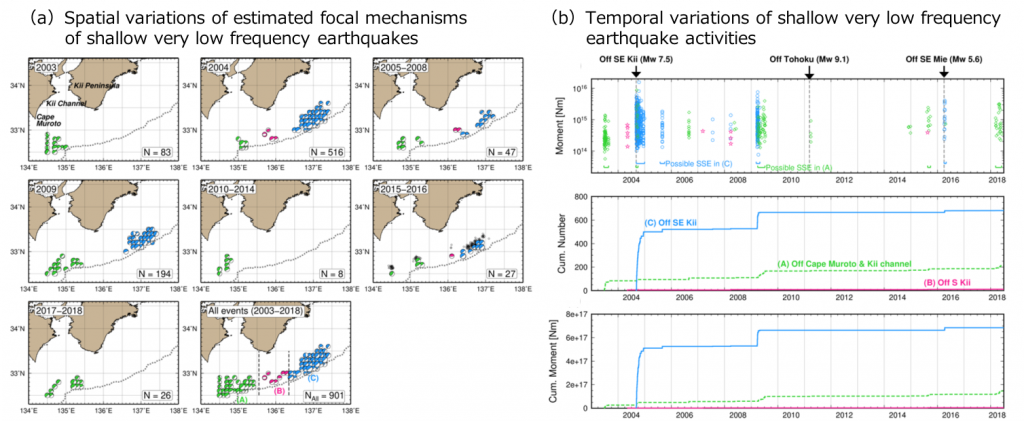
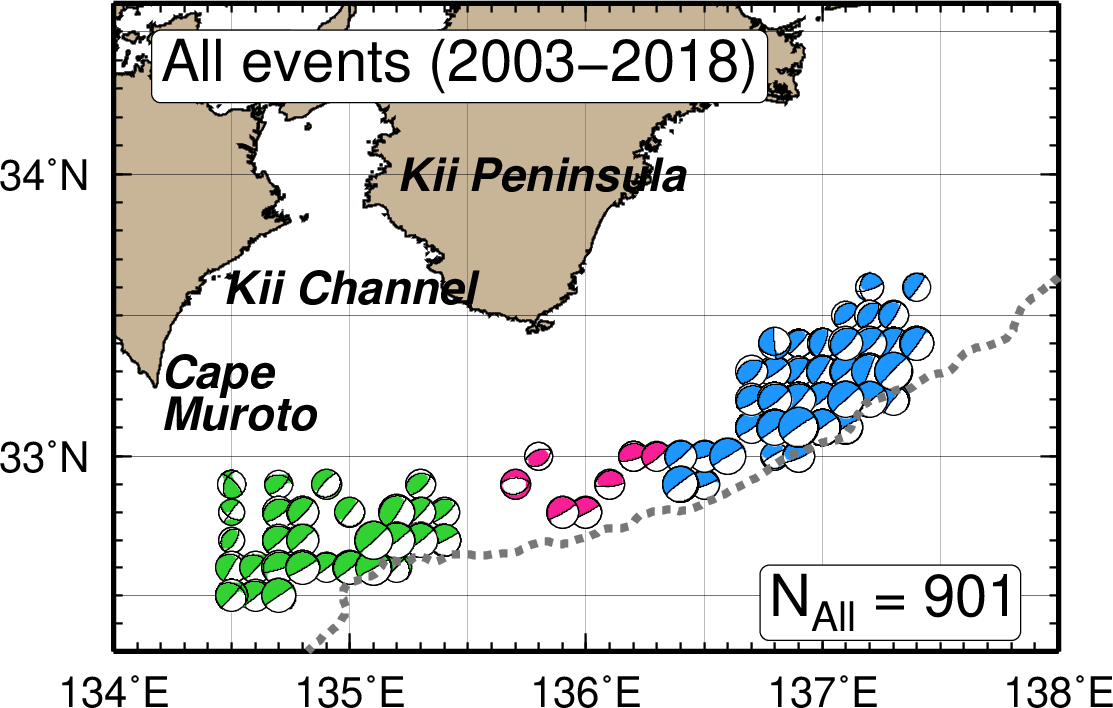
The spatial distributions of shallow slow earthquakes are related to stress accumulation and structural characteristics of the shallow plate boundary, which are important for understanding megathrust earthquakes. Despite this importance, conventional methods using onshore seismograms and one‐dimensional Earth models cannot well constrain the location and magnitude of shallow slow earthquakes due to the effects of three‐dimensional (3‐D) offshore subsurface structures. Moreover, offshore observations near hypocenters are still limited. By applying a method incorporating the effects of 3‐D subsurface structures into long‐term onshore seismograms, we show the spatial variations of well‐constrained shallow very low frequency earthquakes (SVLFEs) along the Nankai Trough, including events that occurred prior to offshore observations. We find that SVLFE activities are related to the spatial variations of the interplate slip‐deficit rate and pore fluid around the Philippine Sea plate boundary. SVLFEs are effectively activated by mechanical weakening due to rich pore fluid in areas surrounding strongly locked zones. Our results imply that spatial variations of long‐term SVLFE activity provide information on tectonic environments, which could constrain the rupture behavior of shallow plate boundaries during future megathrust earthquakes. The SVLFE catalog in this study is available from the GRL website (https://doi.org/10.1029/2019GL082448) or “Slow Earthquake Database” (http://www-solid.eps.s.u-tokyo.ac.jp/~sloweq/).