Aitaro Kato, Shin’ichi Sakai, Satoshi Matsumoto(Institute of Seismology and Volcanology, Kyushu University) & Yoshihisa Iio (Disaster Prevention Research Institute, Kyoto University)
Communications Earth & Environment volume 2, 13 (2021) https://www.nature.com/articles/s43247-020-00086-3
Abstract
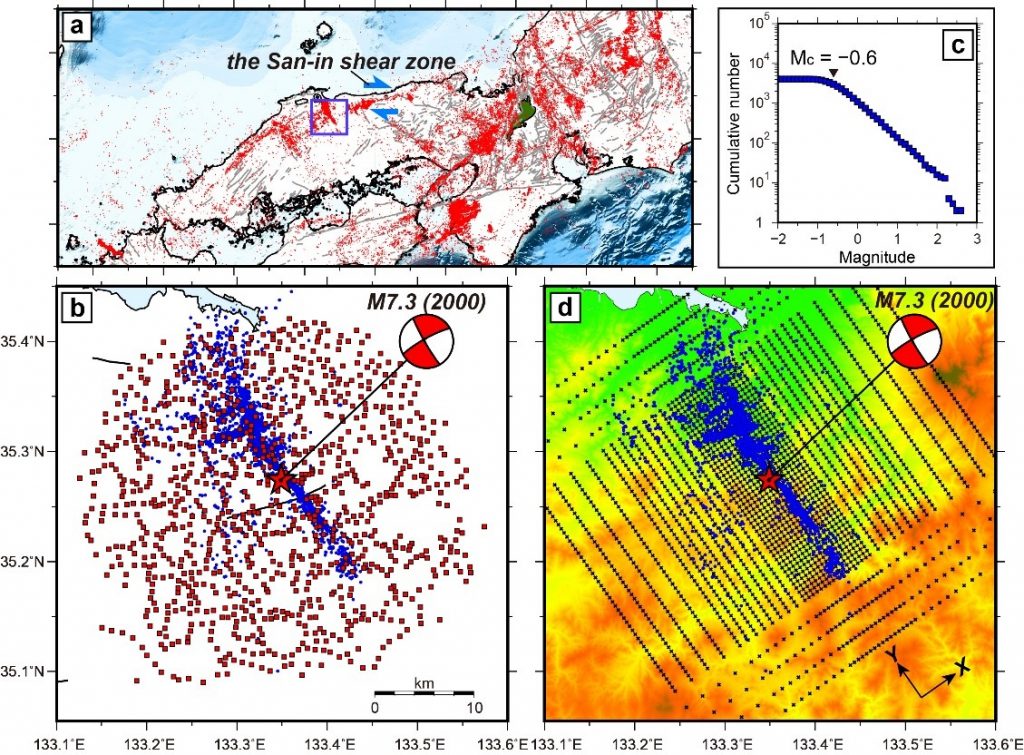
Young faults display unique complexity associated with their evolution, but how this relates to earthquake occurrence is unclear. Unravelling the fine-scale complexity in these systems could lead to a greater understanding of ongoing strain localization in young fault zones. Here we present high-spatial-resolution images of seismic sources and structural properties along a young fault zone that hosted the Tottori earthquake (Mw 6.8) in southwest Japan in 2000, based on data from a hyperdense network of ~1,000 seismic stations. Our precise micro-earthquake catalog reveals conjugate faulting over multiple length scales. These conjugate faults are well developed in zones of low seismic velocity. A vertically dipping seismic cluster of about 200 m length occurs within a width of about 10 m. Earthquake migrations in this cluster have a speed of about 30 m per day, which suggests that fluid diffusion plays a role. We suggest that fine structural complexities influence the pattern of seismicity in a developing fault system.