Morphological evolution of a new volcanic islet sustained by compound lava flows

Morphological evolution of a new volcanic islet sustained by compound lava flows

Fukashi Maeno*, Setsuya Nakada, and Takayuki Kaneko
Earthquake Research Institute, The University of Tokyo

ABSTRACT
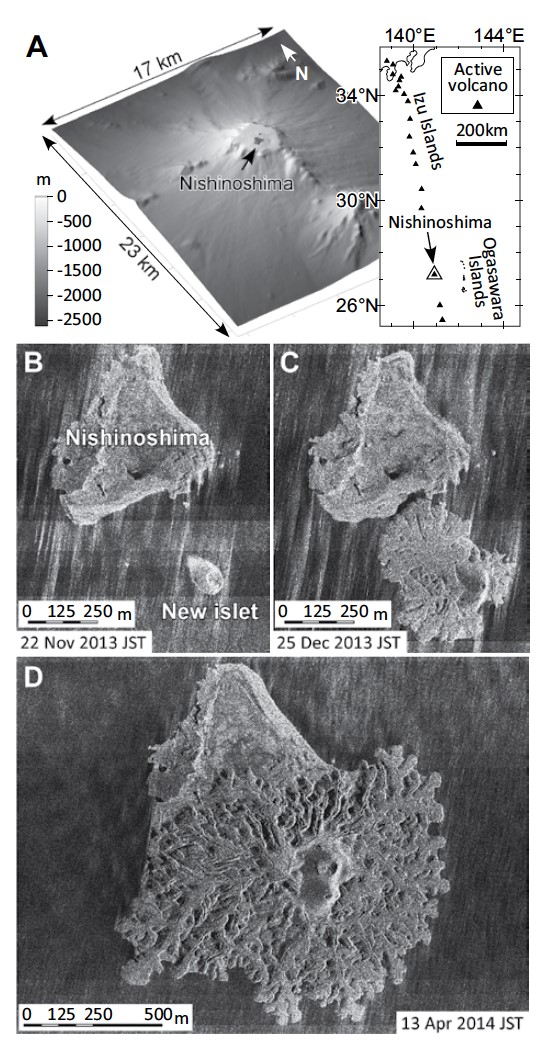
We investigated the creation of a volcanic islet and emplacement of lava flows in the sea by analyzing data from the island-forming eruption at Nishinoshima, Japan, that has been continuing since November 2013. Aerial observations and satellite images were used to perform a quantitative analysis of the eruption processes. The most intriguing characteristic of the lava flows is the development of lobes and tubes from breakouts and bifurcations of andesitic ‘a’ā-type lava flows. Internal pathways that fed lava to the active flow front were eventually developed by crust solidification and dominated the lava transport. The average discharge was ~2 × 10⁵ m3/day, and the total volume of erupted material reached ~0.1 km3 at the end of February 2015. Fractal analysis of the lava-flow margins suggests that the growth pattern is self-similar, with a fractal dimension (D) of ~1.08–1.18, which is within the range of subaerial basaltic lava flows. The morphological evolution of Nishinoshima is controlled primarily by effusion of lava with an apparent viscosity of 104–106 Pa∙s, average discharge of ~2.3 m3/s, and eruption duration lasting ~2 yr. Our data and analyses suggest that the effect of lava coming in contact with seawater, as well as the variations in the lava discharge rateon local and overall scales, are important factors affecting the development of crust and the lava transport system.

maenofig.1
Figure 1. A: Bathymetry of Nisihinoshima, Japan, before A.D. 2013 eruption. B–D: TerraSAR- X satellite images of new island, taken on 22 November 2013, 25 December 2013, and 13 April 2014.JST—Japan Standard Time. TerraSAR-X images ©2014 DLR, Distribution Airbus DS/Infoterra GmbH, Sub-Distribution [PASCO].
Figure 2. Aerial photos of newly emergent islet, Nisihinoshima, Japan. A: New growing volcanic islet, taken on 20 December 2013. Long axis of islet is ~500 m. Preexisting island is seen on left. B: Magnification of lava surface covered by ‘a’ā clinkers. Width of photo covers ~15 m. C: Lava flows advancing into sea in the east, taken on 4 March 2015. Width of lava front at center is ~50 m. NL—new lava lobes where bifurcations begin (thick arrows); EL—early lobes where clefts develop (broken lines with arrows). D: Lava lobes and clefts observed in the southwest on 13 November 2014. Arrows indicate clefts. Width of photo covers ~200 m. E: Glowing lava-flow margin (~200 m in width) at eastern coast, taken on 4 March 2015. Photos A and B and photos C–E were taken by the authors in cooperation with Mainichi Shimbun and Asahi Shimbun, respectively.
Figure 3. A: Evolution of Nishinoshima, Japan, from May to October 2014, based on TerraSAR-X satellite images. Lava lobes I, II, and III correspond to periods of peak lava discharge as shown in B. Black arrows indicate flow directions. Dashed lines indicate earlier lobe front. B: Temporal variation of discharge rate of newly formed part. Black dots and error bars show total values; gray ones represent data above sea level. C: Temporal variation of fractal dimension of lava-flow margins.