Yusaku Tanaka1, Yao Yu2, 3, and Benjamin Fong Chao3
1. Earthquake Research Institute, The University of Tokyo, Tokyo, Japan
2. School of Geodesy and Geomatics, Wuhan University, Wuhan, China
3. Institute of Earth Science, Academia Sinica, Taipei, Taiwan
Terrestrial, Atmospheric and Oceanic Sciences, Vol. 30, No. 2, 1-10
Abstract
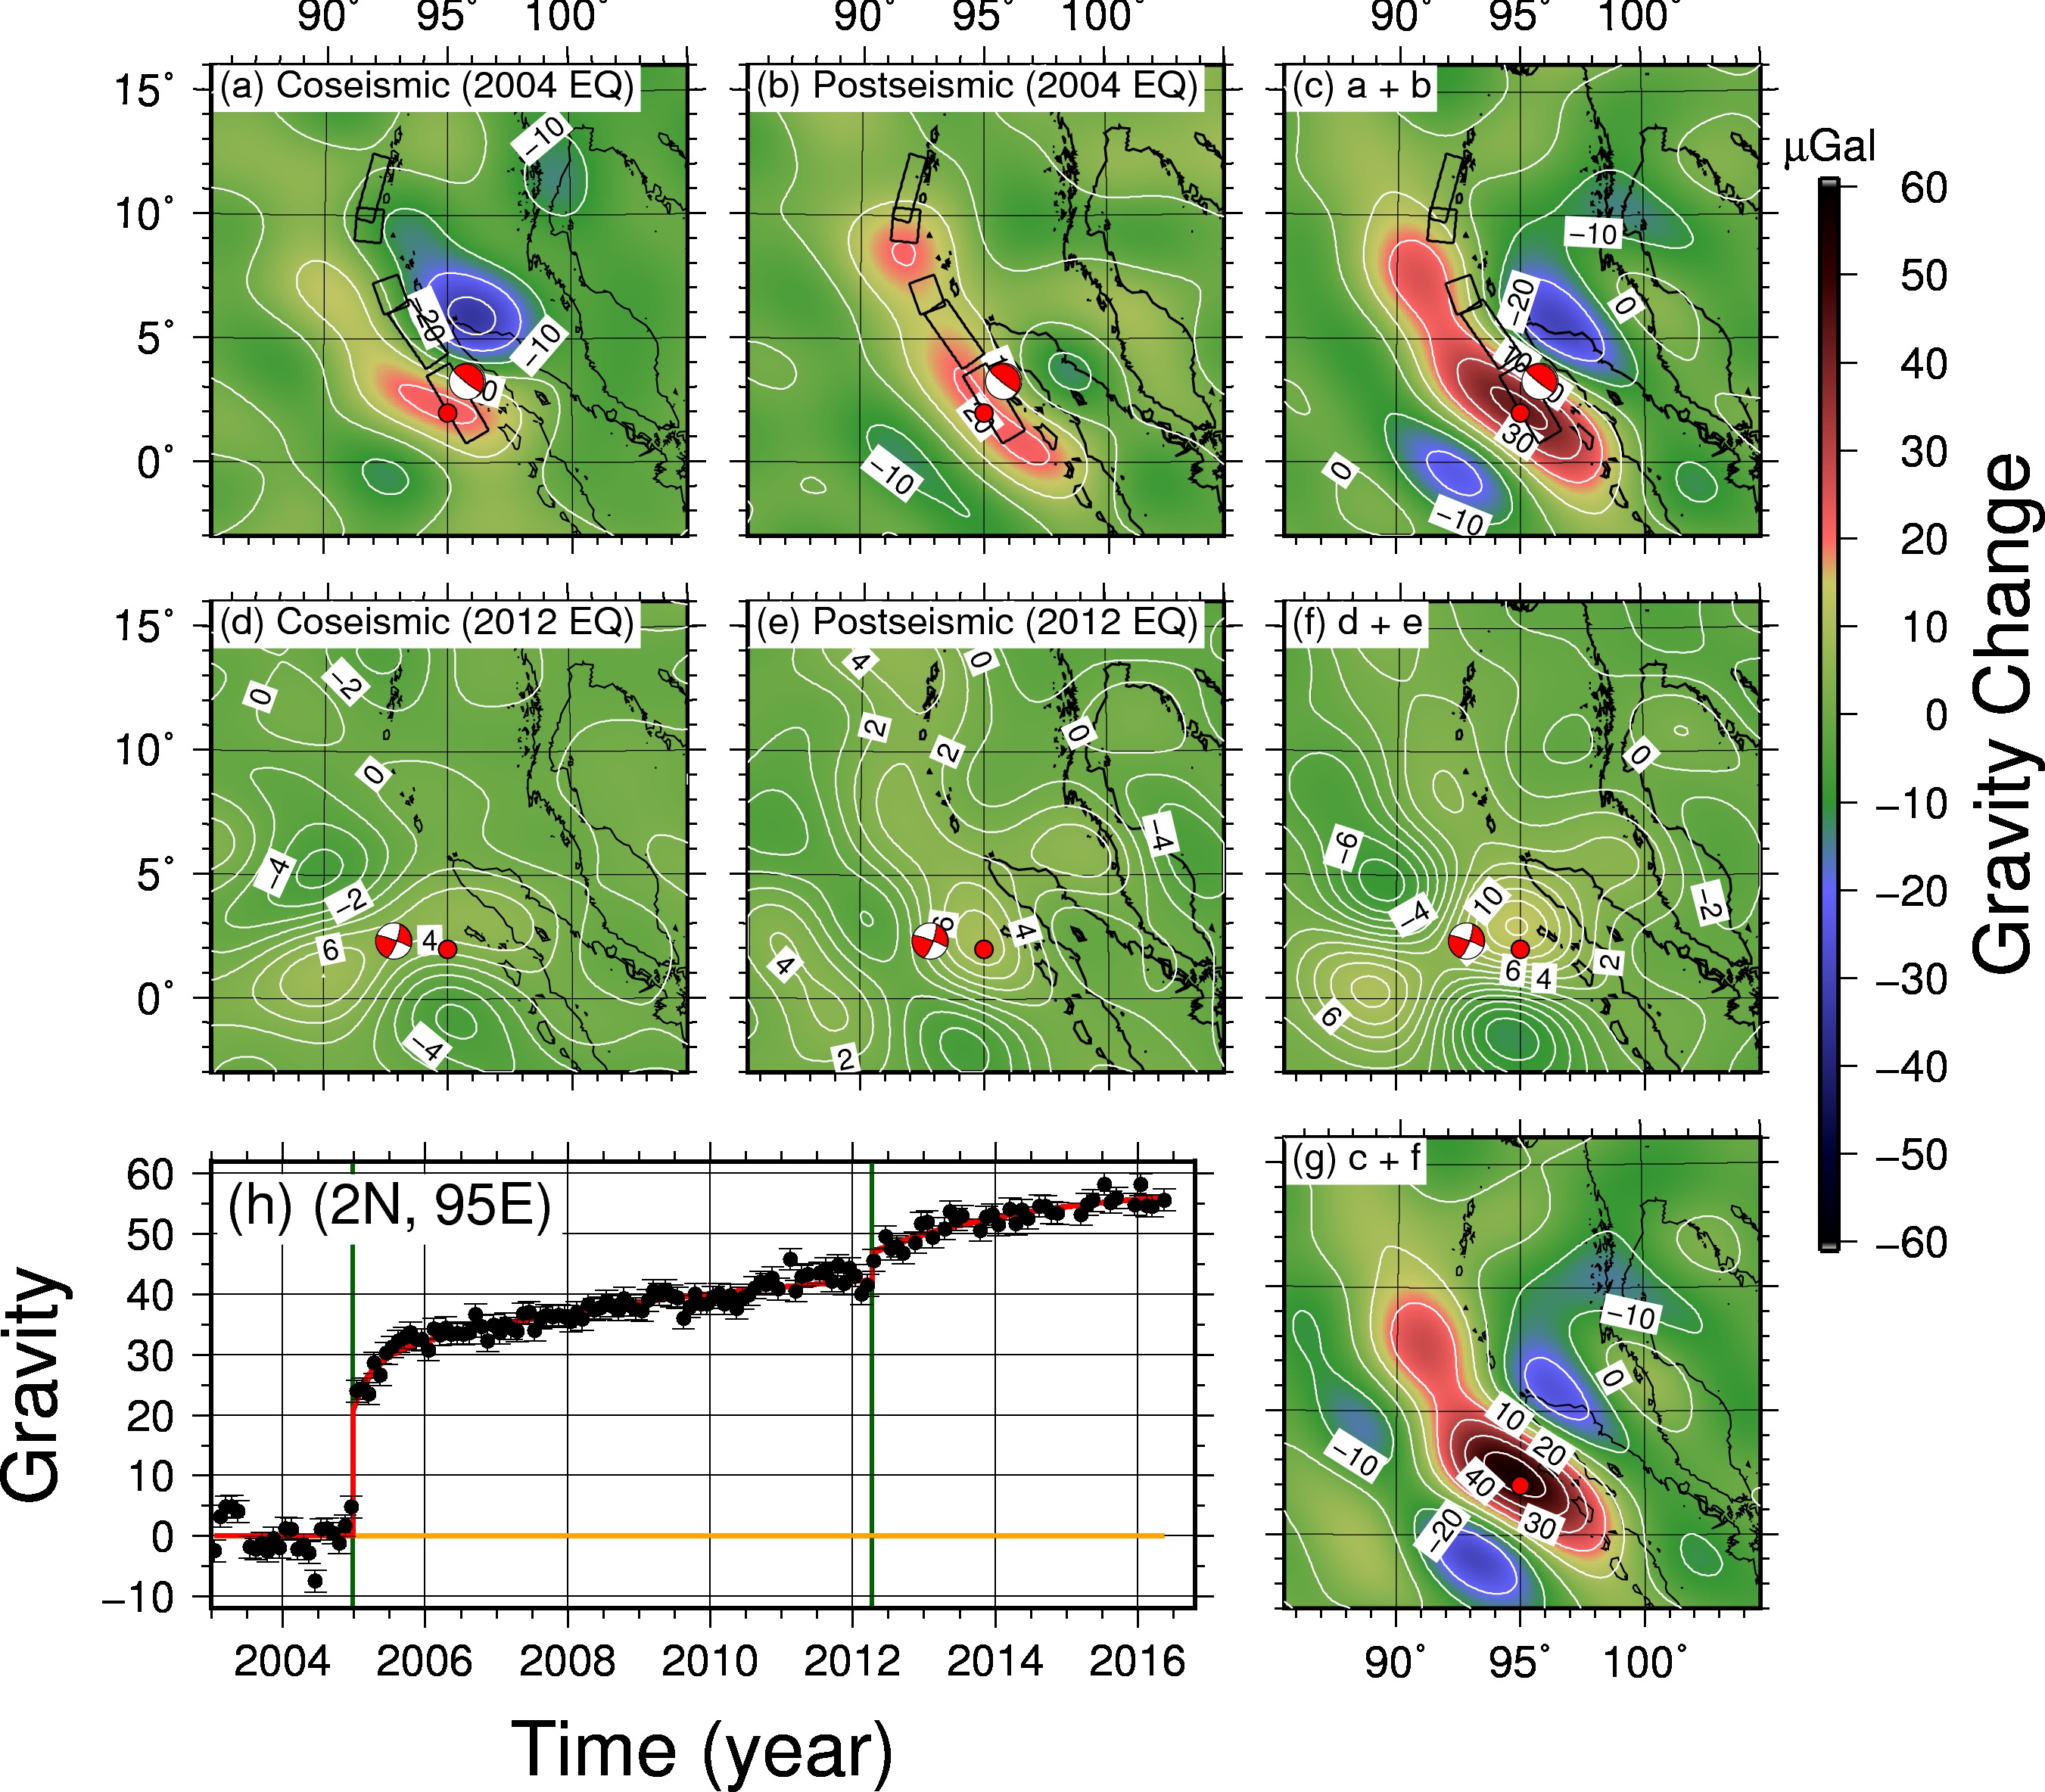
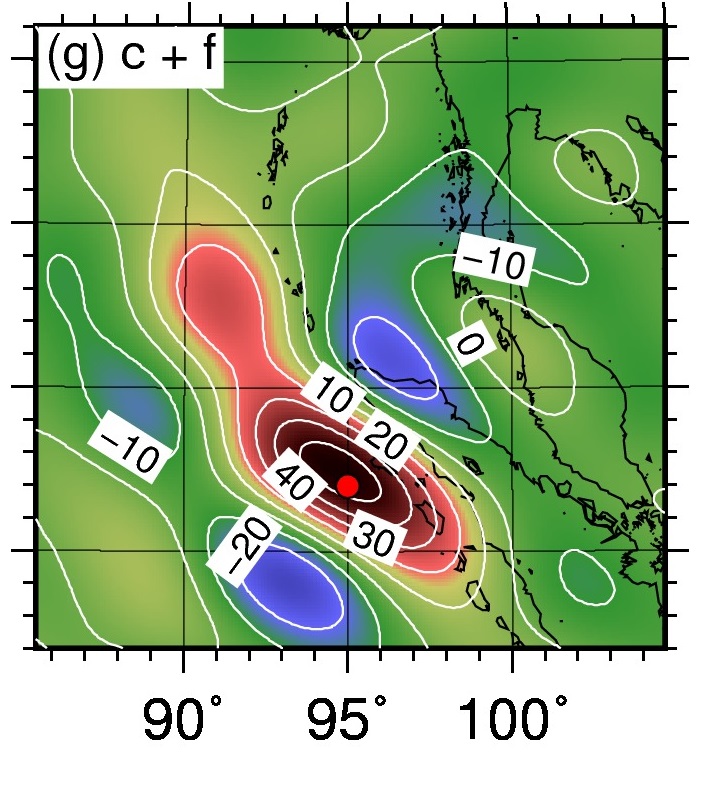
We first report the results from analyzing the GRACE satellite data for the coseismic and long-term post-seismic changes in the Earth’s gravity field and geoid height induced by the 2004 Sumatra-Andaman earthquake (Mw 9.2) and the 2012 Indian-Ocean earthquake (Mw 8.6). The results suggest that the two earthquakes have changed the gravity field and geoid height irreversibly (as opposed to cyclically). We next use satellite ocean altimetry measurements to search for the geoid height change induced by the Sumatra-Andaman earthquake, employing an effective method of extracting coherent space-temporal signals, namely the empirical orthogonal functions (EOF) analysis. Our results demonstrate that the sea level variation in the studied (tropical) area during the studied (10-year) period is dominated by the strong steric changes related to ENSO, to the point that the earthquake-induced signals, even using EOF for the largest earthquakes, are obscured and thus undetectable by ocean altimetry. However, this also means that steric and non-steric changes can be observed separately from artificial satellites.