

T. W. Becker1, A. Hashima2, A. M. Freed3, and H. Sato2
1The University of Texas at Austin, 2ERI, University of Tokyo, 3Purdue University
Earth and Planetary Science Letters, 504, 174-184, doi:10.1016/j.epsl.2018.09.035
Published: 15 December 2018
Key Points
・ Stress pattern change starts ~4 years before the 2011 Tohoku-oki earthquake
・ Stress pattern change sustains after the earthquake until a possible reversal at around 2015
・ Inversions using stress from focal mechanisms promising to understand megathrust process.
Crustal activities due to megathrust earthquakes such as the 2011 Tohoku-oki earthquake (M9) hold important clues for our understanding of plate boundary dynamics and earthquake hazard modeling. Analysis of geodetic time-series for GPS stations indicate that this earthquake was preceded by a remarkable modification of the effective plate boundary deformation starting ∼10 year before the event (e.g. Mavrommatis et al., 2014; Yokota and Koketsu, 2015).
Here, we focus on the temporal evolution of crustal stress before and after the M9 in a larger region around the megathrust. We base our crustal stress analysis on the National Research Institute for Earth Science and Disaster Resilience (NIED) F-net moment tensor catalog.
Fig. 1a shows crustal stress field just before the M9 relative to the long-term up to 2007. The offshore region on top of the future M9 fault slip area shows relative horizontal tension (decrease in compression due to plate convergence). Such a pre-M9 stress field modification might relate to the change in geodetically inferred deformation state of the overriding plate close to the M9.
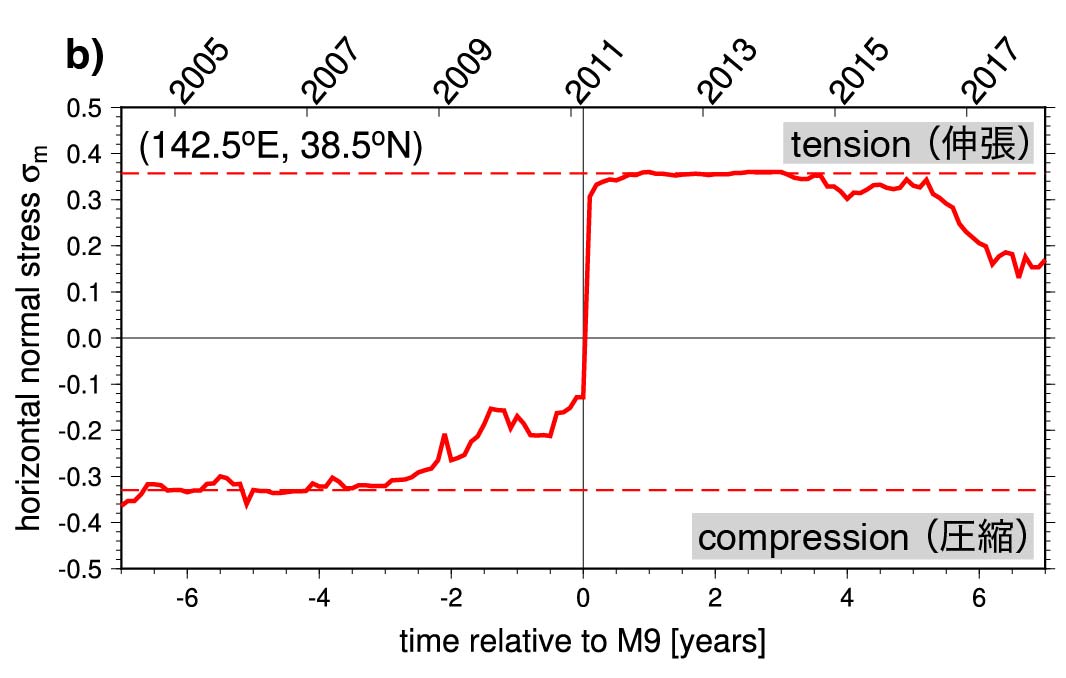
Fig. 1b tracks the total, normalized stress state, σm, for the off-Tohoku area (magenta box in Figs. 1a) over time. Besides the flip in the sign at the M9, it nicely illustrates that the stress-state as inferred from seismicity changed before the M9 starting at ∼2007, and decrease in tension of the long-term state commencing at ∼2014.
The postseismic change shown above might indicate loading of the crust in a style consistent with afterslip on short (∼ one year) timescales, and then perhaps dominance of visco-elastic relaxation on longer timescales, which can be explained by our model. The modeling approaches for exploring both pre- and post-seismic crustal stress change using geodetic constraints is necessary. Such future efforts should provide key insights into time-dependent seismic hazard including earthquake triggering scenarios.
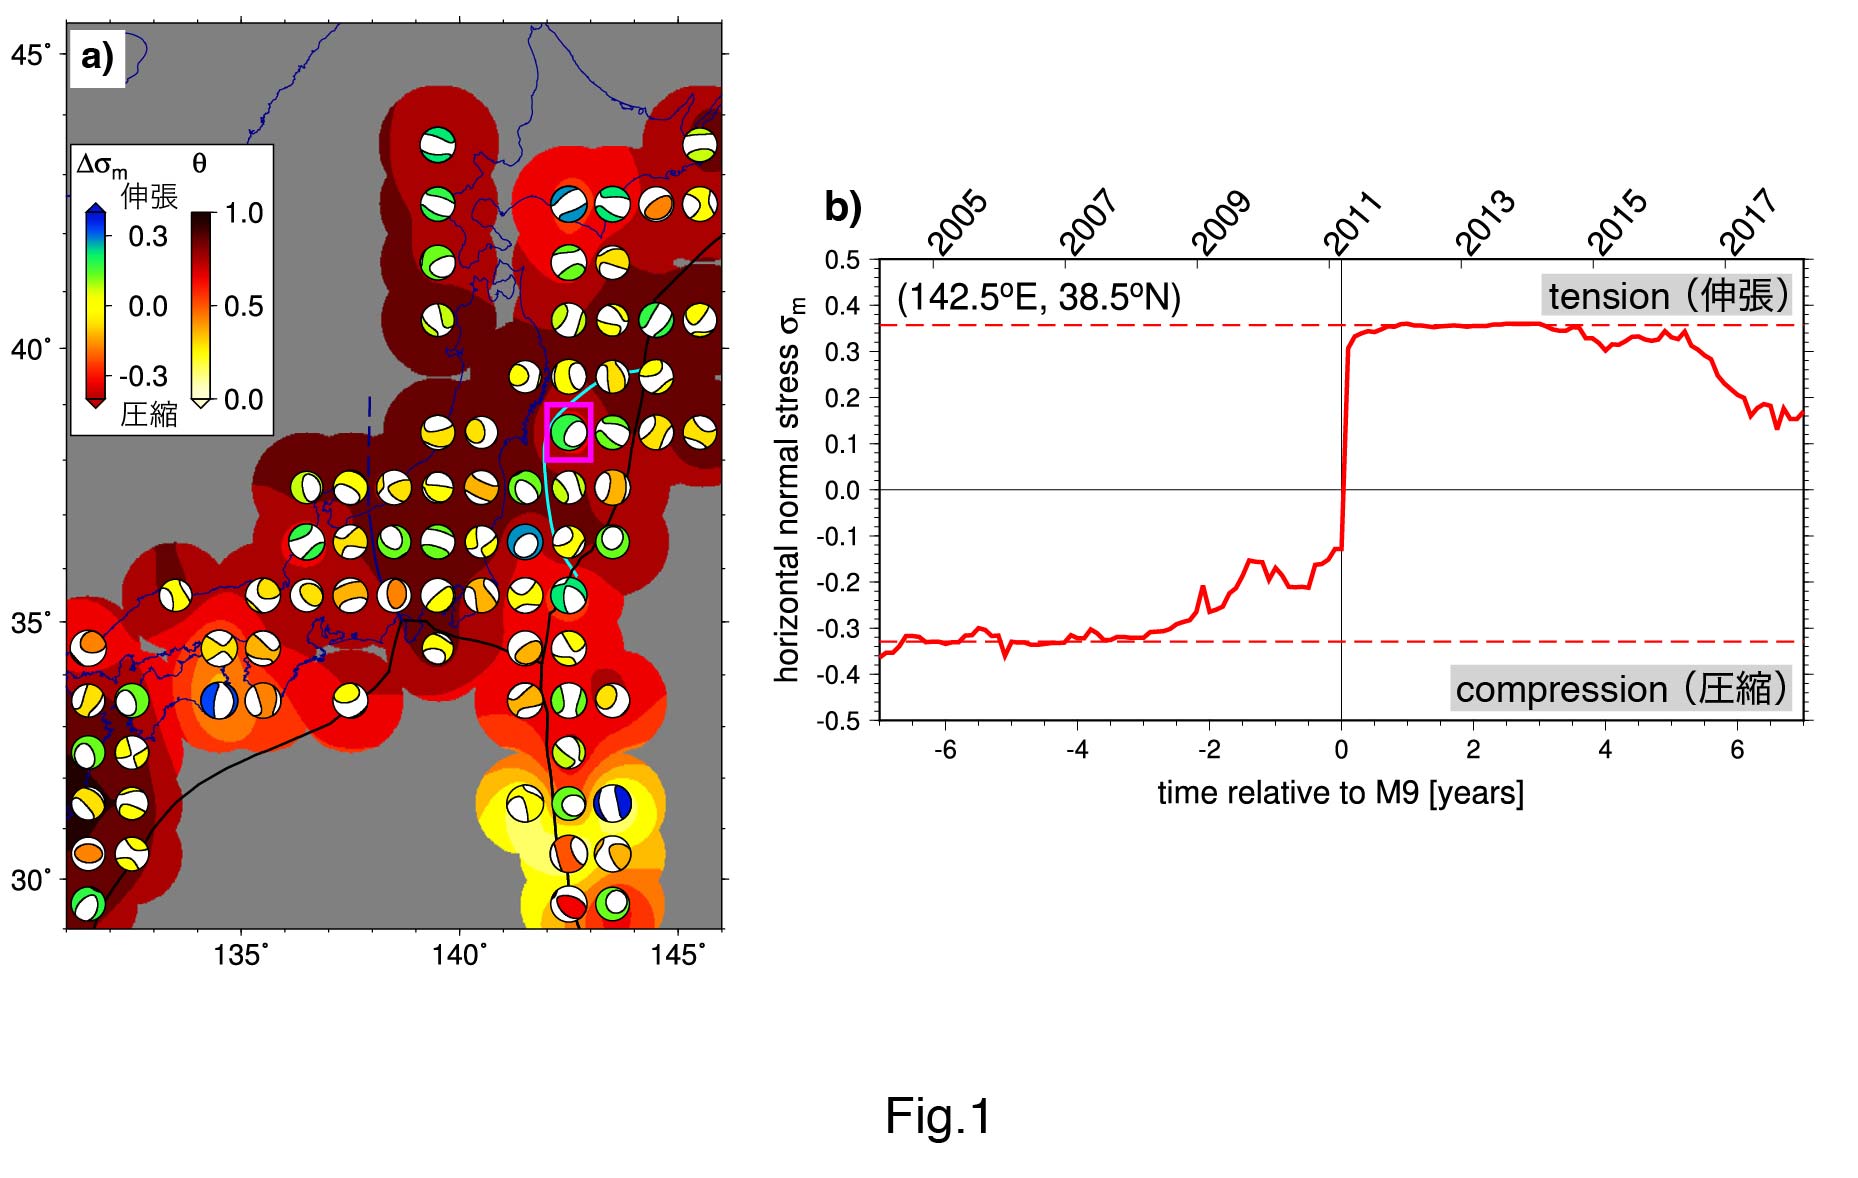 Fig. 1
(a) Anomaly of crustal stress just before the M9 Tohoku-oki earthquake from long-term, pre-M9 crustal stress (1997-2007). Stress symbols are colored with the mean horizontal stress, σm. Negative and positive values indicate horizontal compression and tension, respectively, with shear in between. Background color (θ) shows the similarity between the long-term stress and the stress just before the M9. θ = 1 and θ = -1 correspond to perfect alignment and complete stress-state reversal, respectively. θ is decreased to ∼0.75 throughout much of NE Japan. (b) Mean horizontal stress, σm, vs. time, t, on top of the M9 fault slip area (magenta box in Figs. 1a). Note deviation from presumed long-term, pre M9 compressive state (lower dashed lines show mean σm for t < −4 yr) starting at ∼2007, large jump due to the co-seismic effect of the M9, indication of a short term-transient further increase of σm until a plateau is reached at t∼1 yr (upper dashed lines show mean σm for 1 ≤ t ≤ 3 yr), and ongoing reduction of tension and possible eventual recovery of the compressive long-term state starting at ∼2015.