Yoshimitsu, N., Ellsworth, W. L., & Beroza, G. C. (2019). Robust stress drop estimates of potentially induced earthquakes in Oklahoma: Evaluation of empirical Green’s function. Journal of Geophysical Research: Solid Earth, 124. https://doi.org/10.1029/2019JB017483
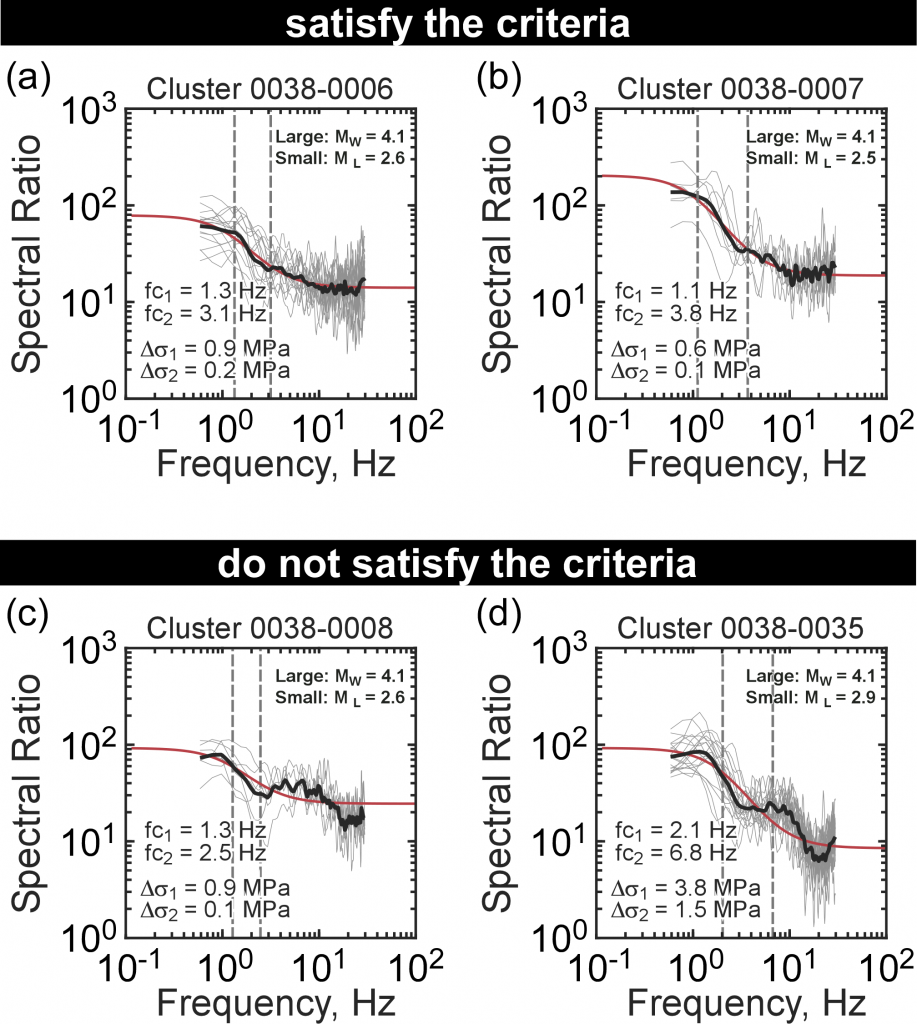
Stress drop has important predictive value for ground motion intensity when determined reliably. Published measurements of stress drop, however, are strongly variable, even for well-studied earthquake populations. Much of that variability arises from uncertainty in the corner frequency. In this study, we use a spectral ratio method to estimate stress drop and focus on assessing the fit to the data to understand trade-offs among the parameters of the spectral model. We consider empirical Green’s function events located within a two km radius for events in the magnitude range 4.5≥Mw≥4 near Cushing, Oklahoma using an accurately relocated earthquake catalog from May 2013 to November 2016. We form composite S coda wave spectral ratios between mainshock – eGf pairs of events. We fit the Brune spectral model to the data over the frequency range from 0.5 to 30 Hz. To examine the characteristics of the spectral ratios, we evaluate the trade-off among three estimated parameters – two corner frequencies and the moment ratio – from 1000 bootstrap resamples of the data. We discard event pairs with a large trade-off between any two parameters and assess the distribution of the residuals to test the suitability of candidate eGf events. Through these processes we reduce the standard deviation of earthquake stress drop estimates. The stress drop estimates after the selection are similar to those of natural earthquakes in the central United States. We conclude that careful eGf event selection has the potential to increase substantially the accuracy of stress drop estimates derived from spectral ratios.


