

László Oláh1,2, Giuseppe Gallo2,3, Gergő Hamar2,4, Osamu Kamoshida2,5, Giovanni Leone2,6,
Edward W. Llewellin7, Domenico Lo Presti2,3,8, Gábor Nyitrai2,9, Takao Ohminato1,
Shouhei Ohno5, Hiroyuki K. M. Tanaka1,2, Dezső Varga2,4
1Earthquake Research Institute, The University of Tokyo, Tokyo, Japan
2 International Virtual Muography Institute, Global, Tokyo, Japan
3 Department of Physics and Astronomy ”E. Majorana”, University of Catania, Catania,Italy
4 Institute for Particle and Nuclear Physics, Wigner Research Centre for Physics, Budapest, Hungary
5 NEC Corporation, Tokyo, Japan
6 The University of Atacama, Copiapó, Chile
7 Department of Earth Sciences, Durham University, Durham, UK
8 National Institute for Nuclear Physics, Catania, Italy
9 Faculty of Natural Sciences, Budapest University of Technology and Economics, Budapest, Hungary
Oláh, L., Gallo, G., Hamar, G., Kamoshida, O., Leone, G., Llewellin, E. W., et al. (2023).
Muon imaging of volcanic conduit explains link between eruption frequency and ground
deformation. Geophysical Research Letters, 50, e2022GL101170.
https://doi.org/10.1029/2022GL101170
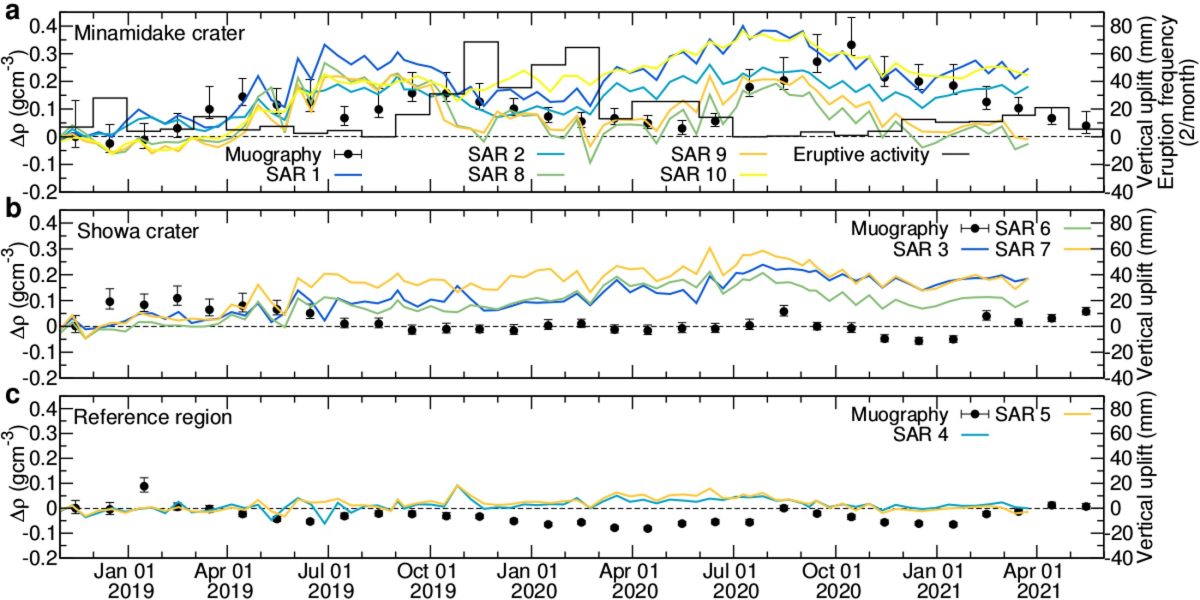
Understanding the physical mechanism of ground deformation at a volcano supports the use of deformation data as a monitoring tool. An inverse correlation was observed between eruption frequency and ground deformation of Sakurajima volcano during November 2018 to April 2021 (Figure 1y). Over the same period, the mass density of magma in the conduit was monitored via muography (Figures 1a-x). Mass density increased during inflation, when eruption frequency was low, and decreased during deflation, when eruption frequency was high (Figure 2a). Periods of low eruption frequency are associated with the formation of a dense plug in the conduit, which we infer caused inflation of the edifice by trapping pressurized magmatic gas. Conversely, periods of high eruption frequency are associated with the absence of the plug, which we infer allows gas to escape, leading to deflation. Muography thus reveals the in-conduit physical mechanism for the observed correlation, with implications for interpretation of deformation at other volcanoes.
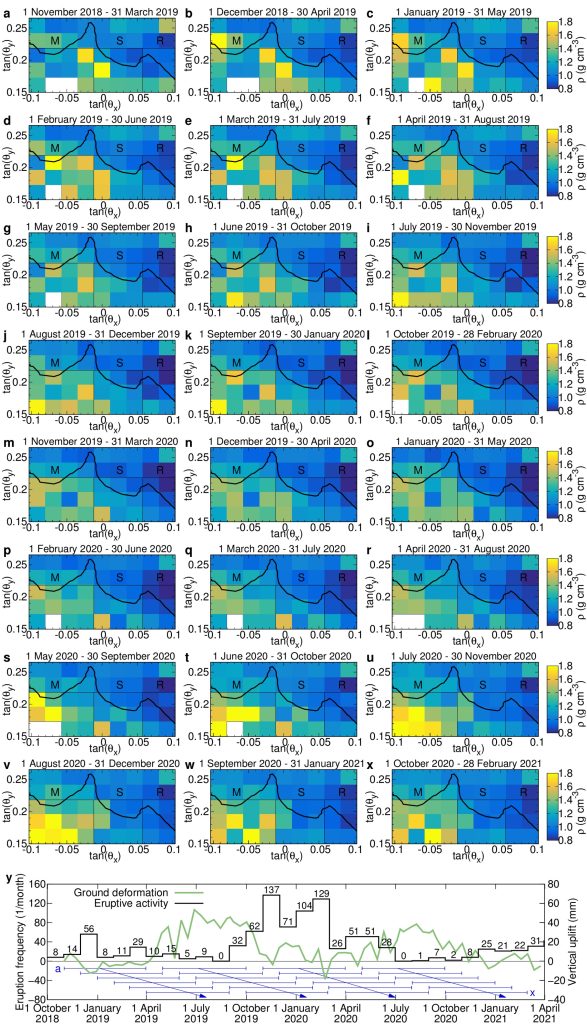
(y) Time-lines of ground deformation (green-coloured line) and eruptive frequency (black histogram) are shown for the Minamidake crater of Sakurajima volcano, Japan. Ground deformation data were recorded with InSAR. The eruptive frequency was determined using the data from Japan Meteorological Agency. Blue arrows are drawn for comparing the a-x images with these time-lines.

1 September 2018 to 31 January 2019. The dots refer to the mids of time intervals. (a) The vertical ground deformations are respectively shown by blue-coloured, light-blue-coloured, green-coloured, orange-coloured and yellow-coloured lines for the locations 1, 2, 8, 9 and 10 at the Minamidake crater. The eruption frequency of Minamidake crater is shown by the black histogram.
(b) The vertical uplifts are respectively shown by blue-coloured, green-coloured and orange-coloured lines for the locations 3, 6 and 7 at the Showa crater. (c) For the Reference region, the vertical uplifts at the locations 4 and 5 are shown by blue-coloured and orange-coloured lines, respectively.