Hu, G., Satake, K., Li, L., & Du, P. (2023).
Origins of the tsunami following the 2023 Turkey–Syria earthquake.
Geophysical Research Letters, 50, e2023GL103997. https://doi.org/10.1029/2023GL103997
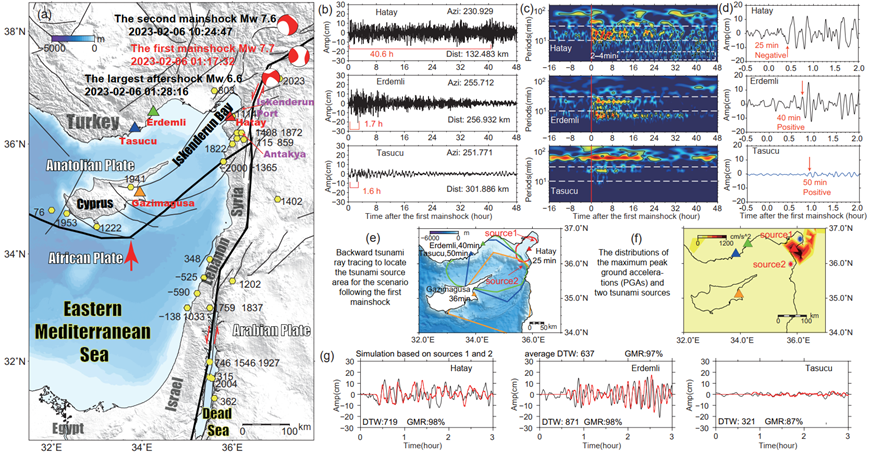
On 6 February 2023, devastating inland strike-slip earthquake doublets of Mw 7.7 and 7.6 events struck southern Turkey and northern Syria with ~9 hours apart (Figure 1a). A local tsunami was recorded in the southeastern Mediterranean Sea following the first earthquake (Figure 1b). The 2023 Turkey-Syria tsunami event broke the long tsunami quiescence in this region since the event associated with the 1953 ML 6.2 Cyprus earthquake.
Due to the lack of underwater observation, the tsunami generation mechanism remains mysterious. To understand the source mechanisms, we analyzed the spectral energy (Figure 1c) and wave behaviors (Figure 1d) of the tsunami waveforms recorded at four nearby tide gauges and located possible sources using a backward tsunami ray tracing approach (Figure 1e). We then conducted forward numerical modeling for a range of possible source parameters. We show that there were probably two tsunami sources (Figure 1f), inside and outside Iskenderun Bay, which may be related to strong ground shakings during the first mainshock and thick coastal sediments. A subsidence source inside the Bay with a characteristic length of 7 km produced dominant periods of 10–30 min with negative initial motion, possibly generated by a landslide. Another uplift source of 6 km length outside the Bay produced dominant periods of 2–10 min with positive initial motions, possibly related with liquefaction. Both sources together can well explain the observed tsunami waveforms (Figure 1g).