Yuji Itoh (1, 2), Anne Socquet (2), Mathilde Radiguet (2)
1.Earthquake Research Institute, The University of Tokyo 2.Univ. Grenoble Alpes, Univ. Savoie Mont Blanc, CNRS, IRD, Univ. Gustave Eiffel, ISTerre, Grenoble, France
Geophysical Research Letters (2023) 50, e2023GL104852. https://doi.org/10.1029/2023GL104852
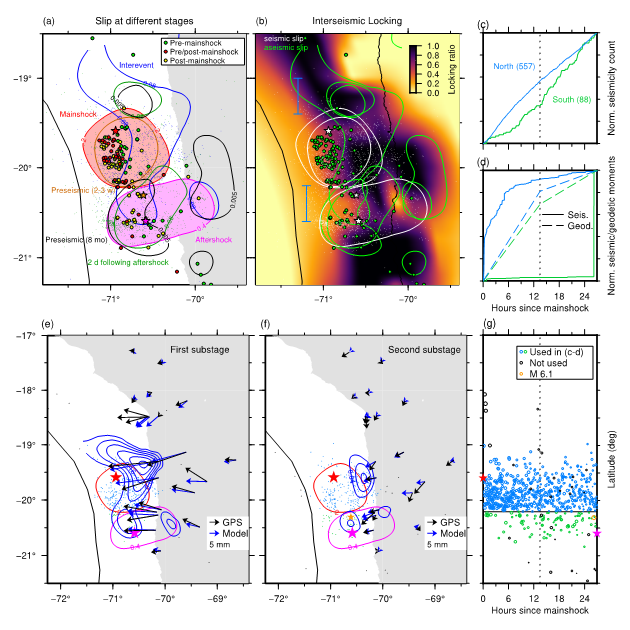
The subduction zone off-Chile, where the oceanic plate subducts beneath the continental plate, has hosted large earthquakes along their interface. The 2014 Iquique earthquake (M 8.1) in the northernmost Chile is one such event (Fig 1a). The largest aftershock (M 7.6) occurred 27 hours later than the mainshock in the south of the mainshock section with an epicentral distance of 130 km (Fig 1a). Given the proximity of the two events in space and time, the two sections could slip simultaneously as a single event, which, however, did not happen for unknown reasons. From earthquake simulations, laboratory experiments using rock samples, and past seismological and geodetic observations, we have learned that aseismic slow slip lacking seismic wave radiation can modulate every stage of earthquake ruptures including nucleation (preparation stage of earthquakes), propagation, termination, and aftershock generation. Hence, we decided to investigate fault slip processes during the 27 hours between the mainshock and the largest aftershock to clarify impacts and modulation of interevent aseismic slip to the Iquique earthquake sequence in 2014.
First, we analyzed the time series of crustal deformation observed by GPS and inferred slip distribution of the mainshock, the largest aftershock, as well as the 27-h-long interevent slip. We found an aseismic afterslip in the south of the mainshock slip area (Fig 1a, 1e-f). Previous studies reported aseismic slips in the same area prior to the mainshock and further before (Fig 1a-b), suggesting that this area is prone to slip aseismically. Simulations employing a fault friction law predict that such aseismic fault can impede and arrest seismic ruptures in a neighbor area, so this aseismic characteristic of this fault prevented the mainshock and the largest aftershock faults from slipping altogether as a single event. In the meantime, interestingly, the largest aftershock epicenter is located in this aseismic slip area, where the seismic, fast rupture of the largest aftershock occurred too. We examined interevent moderate seismicity in this area to clarify the reason for this overlap of seismic and aseismic slips. We found that the decay of occurrence rate and size of the aftershocks, typical of aftershock behavior right after the mainshock, did not occur there (Fig 1c). Rather, relatively larger aftershocks among the interevent moderate aftershocks occurred intermittently (Fig 1d) with an M 6.6 event 45 mins before the largest aftershock occurrence near its epicenter (Fig 1a, 1g). Such behavior of seismicity is similar to the earthquake nucleation process, which is a preparation process for earthquakes. Hence, we suggest that the nucleation of the largest aftershock was driven by the interevent aseismic afterslip. Also, we propose that the spatial overlap of the interevent aseismic and the largest aftershock slips originates from the simultaneous slip of tiny seismic patches embedded in the aseismic area, which are not resolvable with the geodetic observations. Our results suggest that the complex interaction of seismic and aseismic faults yields observed complex seismicity in nature.