Ocean-influenced Rayleigh waves from outer-rise earthquakes and their effects on durations of long-period ground motion

Shinako Noguchi,1 Takuto Maeda2 and Takashi Furumura2
1Association for the Development of Earthquake Prediction (ADEP)
2Earthquake Research Institute, The University of Tokyo

Geophys. J. Int., 205(2), 1099-1107, doi:10.1093/gji/ggw074, 2016

SUMMARY
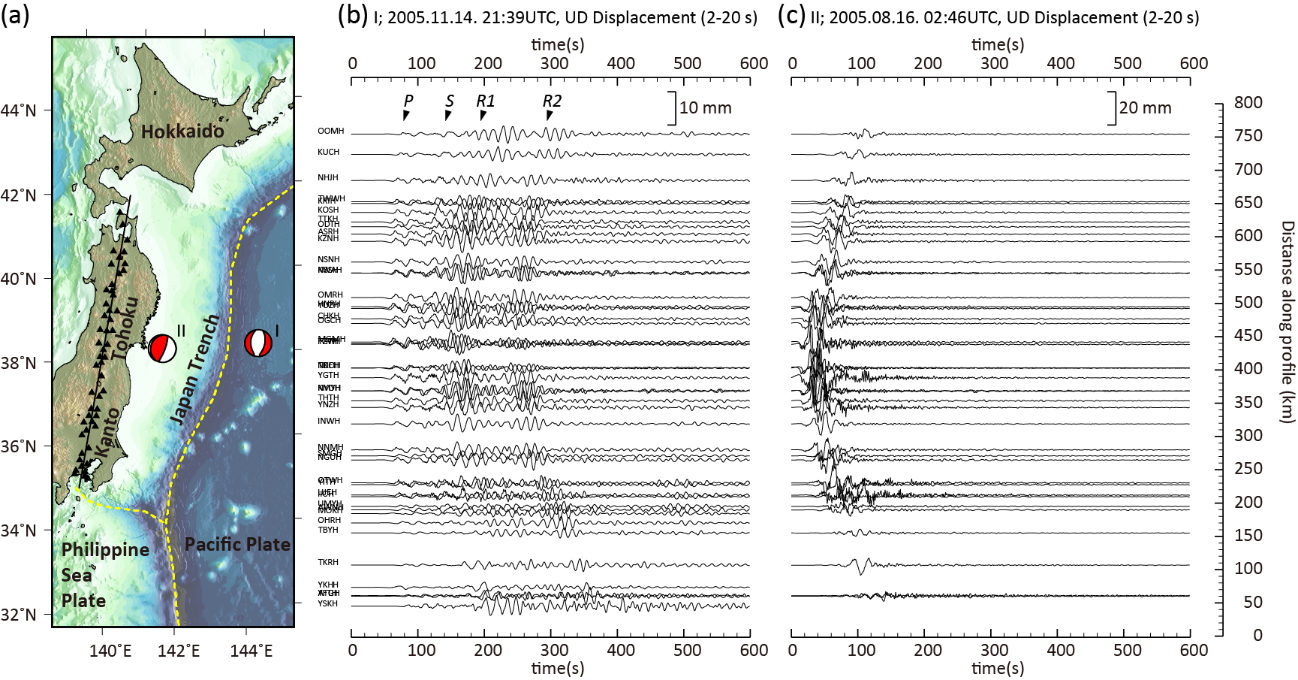
We investigate the cause of anomalously long duration (>100 s), long-period (T = 13–14 s) phase packets following the Rayleigh wave, which are observed widely in eastern Japan during outer-rise earthquakes. As this phase is not seen in records of interplate earthquakes, the late long-period phase is assumed to develop as a result of propagation across the Japan Trench.
Using 3-D finite-difference simulations of seismic wave propagation with a detailed structural model that includes seafloor topography and water layers, we demonstrate that the late phase could be generated by a fundamental-mode oceanic Rayleigh wave propagating in the deep
Pacific (at a depth of 6 km), which converts to a fundamental-mode continental Rayleigh wave as it crosses the Japan Trench. Our models suggest that the conversion is caused by the change in bathymetry. Based on analysis of surface wave dispersion, we confirm that the first arrival of the Rayleigh wave on land can develop from the first higher mode oceanic Rayleigh wave.
The successive arrivals of the two types of Rayleigh waves on land produce ground motions with very long durations after outer-rise earthquakes.

maeda_fig1
Figure 1. Vertical-component displacement seismograms for: (b) an outer-rise event (B in Table 1 and Fig. 1) and (c) a deep interplate event (A in Table 1 and Fig. 1), along a profile from Tohoku to Kanto (straight black line in (a)), with Hi-net stations indicated by black triangles. All waveforms are bandpass filtered at 2–20 s and normalized by the maximum of all waves during each event. See Table 2 for additional information about each phase.
Fig2.Snapshots of vertical-component displacement motions at the surface and seafloor, taken from FDM simulations at times t = 70, 100, 150, 200 and 250 s from the earthquake origin time. Lower panels show cross-sections along the dashed line in the upper panels. (a)–(e) are taken from a simulation with a model that includes water; (f)–(j) are from the corresponding simulation whose model excludes water. Up- and downgoing motions are shown in red and blue, respectively. The yellow star in each plot shows the hypocentre. Phase labels are explained in Table 2. See also Animation S1 in Supplementary Information.

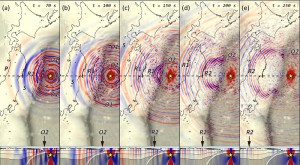
(Click the figure to see animation)