

Takemura, S.1, Kubota, T.2, Sandanbata, O.1, (2024).
Successive tsunamigenic events near Sofu Seamount inferred from high‐frequency teleseismic P and regional T waves.
Journal of Geophysical Research: Solid Earth, 129, e2024JB029746. https://doi.org/10.1029/2024JB029746
1ERI UTokyo, 2NIED
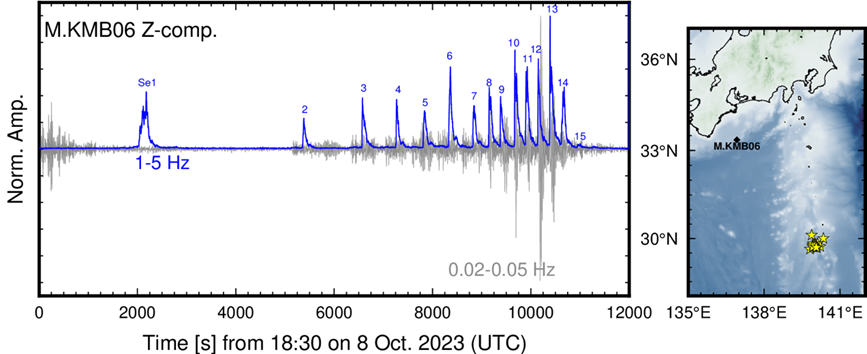
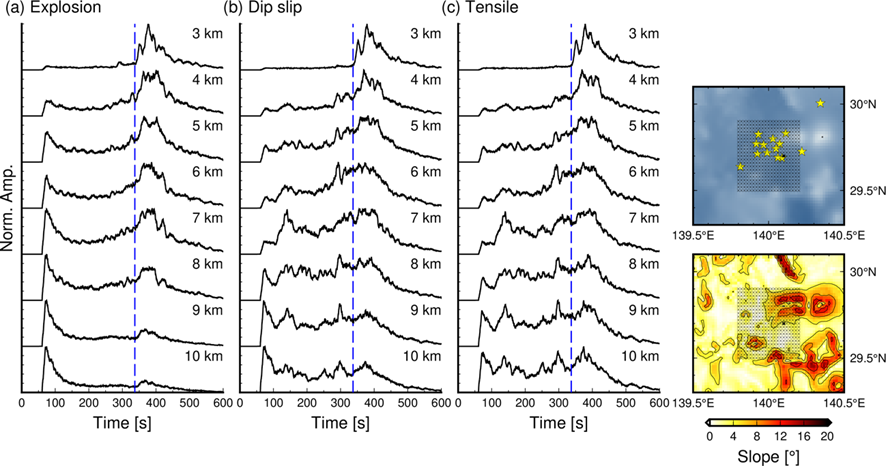
On 8 October 2023, an earthquake sequence, which included 15 moderate-size (magnitudes of 4.3-5) earthquakes, was observed in the region near Sofu Seamount. When a moderate-size (M < 6) earthquake occurs in offshore regions, we generally observe no tsunami signals. However, during this earthquake sequence, an unexpected major tsunami was observed along the coast of Japan (Sandanbata et al., 2024). To investigate tsunami sources near Sofu Seamount, we analyzed observed T waves at ocean-bottom seismometers near the coast of southwest Japan (Figure 1). T waves are ocean acoustic waves and can effectively propagate at distances larger than several thousand kilometers. Observed T waves were significant compared with P waves, propagating through the subsurface. We also analyzed simulation results of high-frequency seismic wave propagation from Sofu Seamount to the Japanese coast. Comparing simulation results (Figure 2) with observed T waves allows us to constrain the depth of moderate-size earthquakes. Because efficient T-wave generation only appears in shallower sources, moderate-size earthquakes should be located at depths ≤ 0.5 km below the seafloor (examples are shown in the top panels of Figure 2), and such shallower seismic/deformation phenomena might cause observable tsunamis even for magnitudes ≤ 5.
The peak seafloor uplifts estimated from tsunami records (Kubota et al., 2024) and peak amplitudes of T waves during this sequence were scaled. In the future, the database of T waves from various submarine volcanoes may help tsunami prediction.
References
Sandanbata, O., Satake, K., Takemura, S., Watada, S., Maeda, T., & Kubota, T. (2024). Enigmatic tsunami waves amplified by repetitive source events near Sofugan volcano, Japan. Geophysical Research Letters, 51, e2023GL106949. https://doi.org/10.1029/2023GL106949
Kubota, T., Sandanbata, O., Saito, T., & Matsuzawa, T. (2024). Accelerating seafloor uplift of submarine caldera near Sofugan Volcano, Japan, resolved by distant tsunami recordings. Geophysical Research Letters, 51, e2024GL108415. https://doi.org/10.1029/2024GL108415